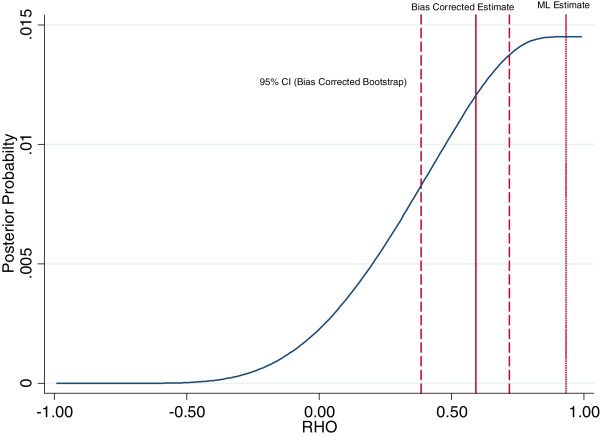
Figure 2.

Posterior probability distribution for the correlation between HIV Testing and HIV Status in Ghana 2003 (Men). Graph shows the posterior probability distribution for the correlation between testing and HIV status ρ = corr(u ij, ϵ ij), calculated using a selection model with a flat prior probability distribution over the interval [-1,1], and interviewer random effects as the exclusion restriction. The standard maximum likelihood (ML) estimate is shown, as well as the bias corrected estimate which is the mean of the posterior probability distribution. Also shown is the 95% bootstrap confidence interval for the bias corrected estimate, based on 1,000 replications. The bootstrap confidence interval is calculated using the empirical distribution of bootstrap estimates. Details of the statistical procedure are outlined in the appendix (see Additional file 1). The fact that the maximum likelihood estimate lies outside the bootstrap confidence interval for the bias corrected estimate reflects the fact that the posterior distribution has a long left hand tail which is not accounted for by the standard maximum likelihood estimator, and that we use the empirical distribution of the bootstrap estimates to allow for asymmetry when calculating the confidence interval. Source: DHS Ghana 2003 (men).
