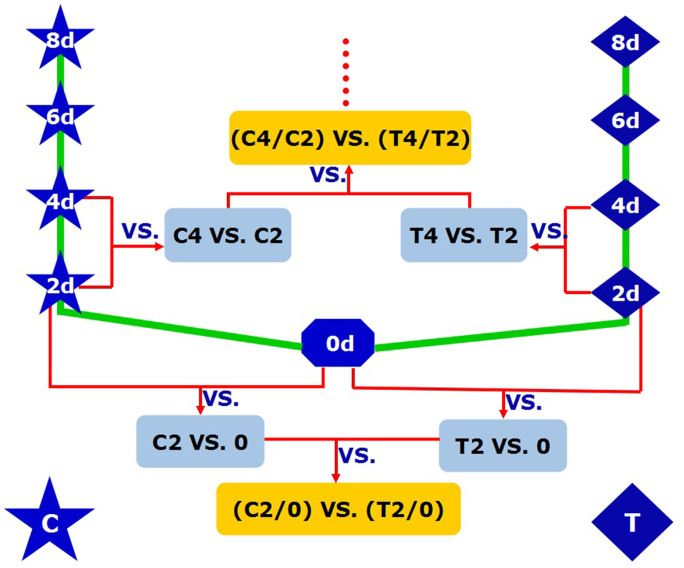
Figure 1. The experimental design.
Firstly, we compared DGE profiles of the libraries of aphid infestation (T2 vs. 0, T4 vs. T2, T6 vs. T4, T8 vs. T6) and control (C2 vs. 0, C4 vs. C2, C6 vs. C4, C8 vs.C6) respectively, and then compared (T2/0) vs. (C2/0), (T4/T2) vs. (C4/C2), (T6/T4) vs. (C6/C4) and (T8/T6) vs. (C8/C6) to obtain the differentially expressed genes, eliminated it derived from growth and development of the plant itself, caused by aphid infection. T4/T2 means the differentially expressed genes after 4 d and 2 d infected by aphids, C4/C2 means the differentially expressed genes after 4 d and 2 d caused by growth and development of the plant itself, and (T4/T2) vs. (C4/C2) means the differentially expressed genes, eliminated differentially expressed genes caused by plant growth and development, caused by aphids infestation after 4 d and 2 d.

