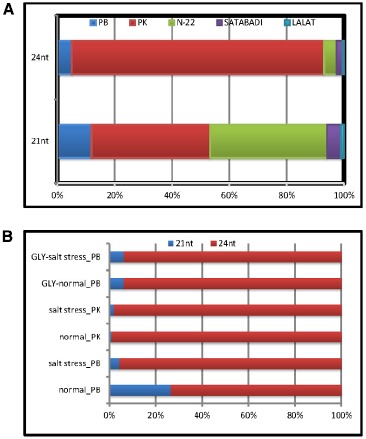
FIGURE 2.

Relative expression patterns of Osa-miR820 length variants. The graph was plotted based on the TPM values obtained from the Illumina sequencing data of different small RNA libraries of rice. The values are presented as percentage to calculate the relative expression. (A) Relative expression in the healthy panicle tissues from different indicia rice cultivars. PB, Pusa Basmati 1; PK, Pokkali; Gly, glyoxalase overexpressing PB1 transgenics; N-22, Nagina 22; Satabdi, and Lalat. (B) Relative expression in the normal (unstressed) and salt stressed leaf tissues from different rice cultivars.
