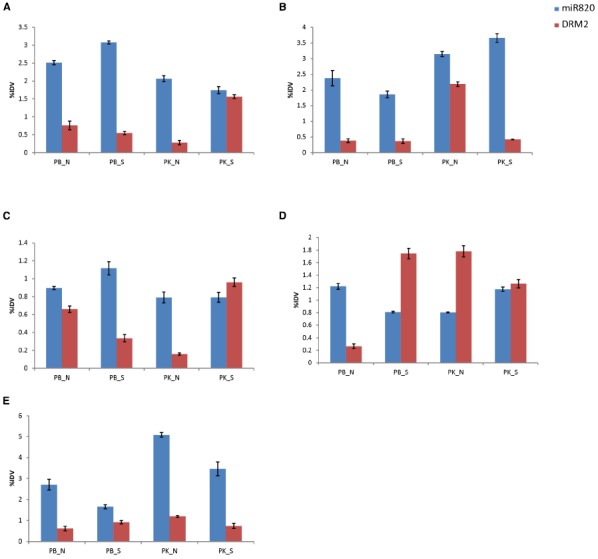
FIGURE 5.

Expression profiling of Osa-miR820 and its target, OsDRM2 in different floral tissues of Pusa Basmati 1 (PB) and Pokkali (PK) under control (N) and salt stressed (S) conditions. (A) superior spikelets, (B) inferior spikelets, (C) pre-pollinated panicle, (D) post-pollinated panicle, (E) flag leaf. The integrated density values (IDV) were normalized with 18S rRNA and plotted as percentage relative abundance. The error bards indicate the standard deviation.
