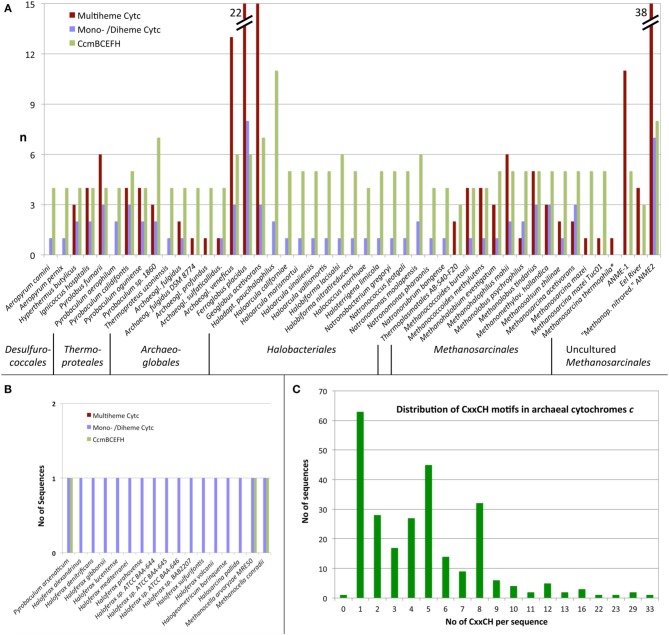
Figure 2.
Distribution of cytochromes c in Archaea predicted from protein sequences. (A,B) Number of predicted MCCs, combined diheme and monoheme Cytc and number of CcmB, CcmC, CcmE, CcmF, and CcmH homologs per proteome in species with (A) and without (B) significant number (≥3) of CCM homologs; (C) Frequency of CxxCH motifs per protein.

