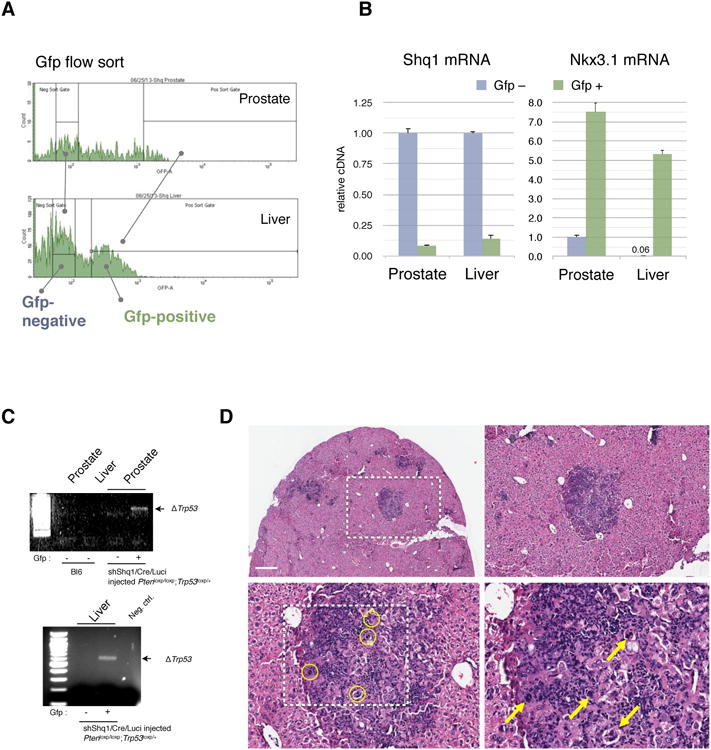
Figure 3. Molecular and histological analysis of Shq1-mutant metastasis.

(A) FACS flow sort profile and gates used for separation of Gfp-negative from Gfp-positive cells that were isolated from the LV-shShq1-Gfp positive prostate and liver tissue shown in Figure 2C.
(B) RT-qPCR for Shq1 transcription in the isolated tissue demonstrates greater than 80% knockdown of Shq1 expression in both prostate and liver tissue (left graph). Right graph: Gfp-positive cells from liver show expression of the prostate epithelial marker Nkx3.1, at levels similar to the Gfp-positive cells in from prostate. Error bars show standard deviation of experimental triplicates.
(C) PCR analysis demonstrating recombination in Gfp-positive cells from prostate and liver from the same LV-shShq1-Gfp injected RapidCaP mouse (Figure 2A).
(D) Overview and high magnification H&E analysis of liver from the LV-shShq1-Gfp injected RapidCaP mouse depicted in Figure 2C reveals metastatic nodules that contain tumor cells (circles and arrows) at high magnification. Scale bar, 500μm.
