Figure 5.

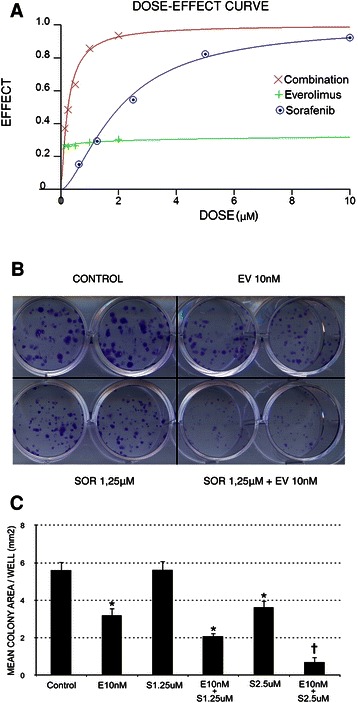
Synergistic anti-proliferative effects of sorafenib and everolimus on MES-MM98 cell lines, calculated according to the number of viable cells in culture based on quantitation of the ATP present. (A) Representative dose-effect curve of MES-MM98 cells treated with scalar doses of sorafenib, everolimus or their combination. The dose effect curve was calculated by CalcuSyn software after 72 h of treatment. (B) Photograph of a representative colony growth of MES-MM98 cells after 10 day-incubation in complete medium alone (NT) or with sorafenib (SOR 2.5 μM), everolimus (EV 10 nM), or their combination (SOR 2.5 μM + EV 10 nM). (C) Analysis of the total surface area occupied by colonies/well after treatment with escalating doses of sorafenib (0, corresponding to control, 1.25 μM and 2.5 μM), alone or in combination with everolimus (10 nM). *p < 0.05 vs NT; †, p < 0.05 vs both single agents and control. Results are expressed as mean ± standard deviation of triplicate experiments.
