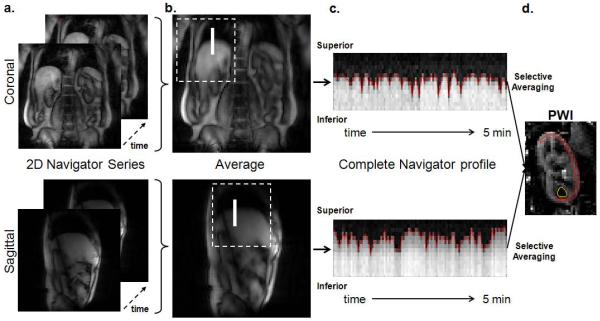
Figure 2.
The automated process of identifying the sub-navigator. (a) Examples of the 2D navigator images. (b) Averaged navigator images. The dotted square indicates the region extracted for the normalized 2D correlation calculation with the predefined template matrix. The resulting sub-navigator region is indicated by the white solid line. (c) The navigator profile across the entire acquisition. The red dotted line indicates the diaphragmatic position identified by the edge detection algorithm. (d) A perfusion weighted image (PWI) can be obtained by subtraction after selective averaging. An example of renal cortex and medulla ROIs are illustrated with red and yellow lines, respectively.

