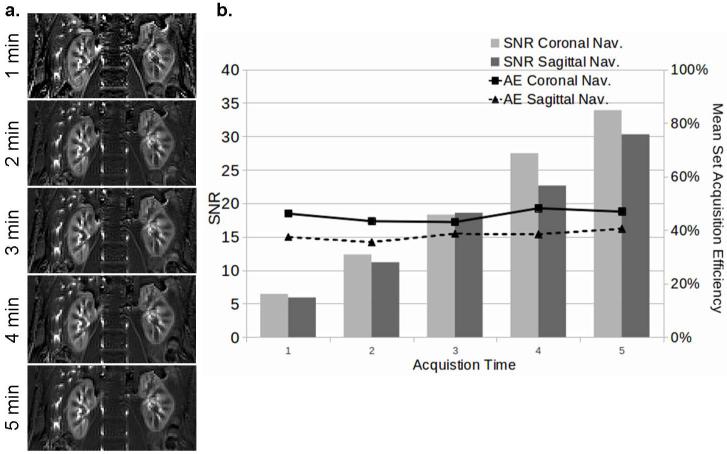
Figure 6.
Reconstruction results of multiple sets with variable acquisition lengths. (a) Perfusion weighted images retrospectively reconstructed from data acquired in an increment of 1 minute with 2D coronal navigator (subject 4 in Table 2). (b) A plot of mean SNR (bar chart) and set acquisition efficiencies (AE) (which remained relatively constant) versus acquisition time.

