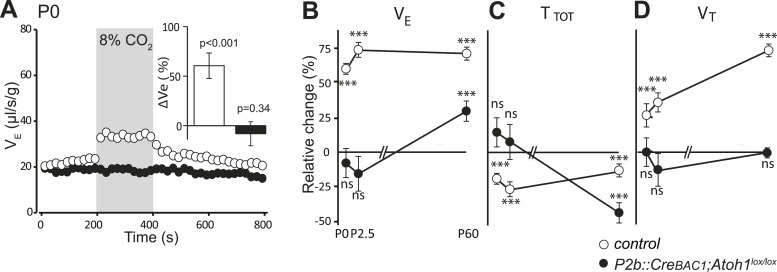
Figure 10. Defective CO2 chemosensitivity after inactivation of Atoh1 in Phox2bon cells.
(A) Plethysmographic recording of P0 pups. Shown are the mean values of VE in air or in response to 8% CO2 in P2b::CreBAC1;Atoh1lox/lox mutants (black circles) and controls (empty circles). Inset, ventilatory response to hypercapnia expressed as the percentage change relative to baseline for controls (white bar) and mutants (black bar). (B–D) Mean relative changes of ventilation (VE) (B), breath duration (TTOT) (C) and tidal volume (VT) (D) measured in P0 (control n = 31; mutant N = 13), P2.5 (n = 17; N = 9) and P60 (n = 19; N = 11) mice breathing normal or hypercapnic air (8% CO2). ***p < 0.001, n.s. = p > 0.05 (hypercapnic vs room air).

