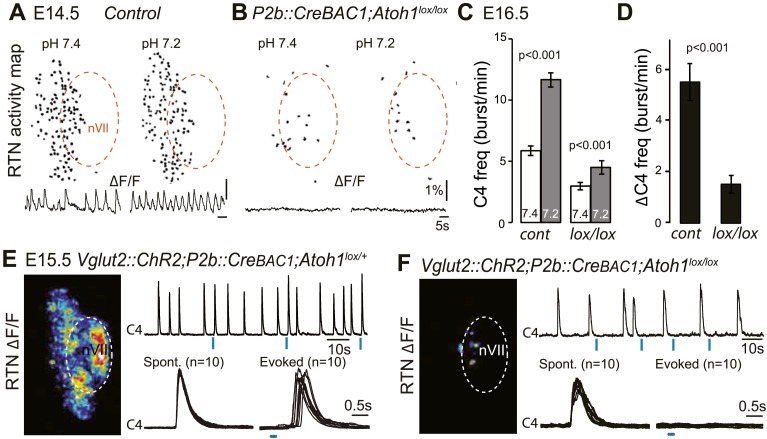
Figure 8. Functional consequences of selective inactivation of Atoh1 in Phox2bon cells.
(A and B) RTN activity maps and average population activity traces at E14.5 in control and P2b::CreBAC1;Atoh1lox/lox mutants at pH7.4 and pH7.2 showing absence of a functional RTN in the mutant. (C) Quantification of C4 burst frequencies in baseline (white bars) and low pH (gray bars) conditions in control and mutant E16.5 preparations. Baseline frequency dropped by 49% in the P2b::CreBac1;Atoh1lox/lox mutants (lox/lox) and increased at pH 7.2 by 51 ± 10% above the pH7.4 value vs 106 ± 17% in the controls (cont). (D) Corresponding change of C4 frequency (ΔC4) induced by a pH challenge in P2b::CreBAC1;Atoh1lox/lox (lox/lox) compared to control (cont) preparations. (E) Left panel, photostimulation of the RTN region at E15.5 evokes ΔF/F changes in the RTN and adjacent nVII (dotted line) in Vglut2::ChR2;P2b::CreBAC1;Atoh1lox/+ preparations. Right panel, above, integrated C4 activity showing spontaneous bursts and bursts evoked by light pulses (blue bars) triggered 4 s after a spontaneous burst. Bottom left, close-up of a set of 10 superimposed spontaneous (Spont.) C4 bouts of activity and right, a corresponding set of light-evoked (Evoked) C4 responses, synchronized on the light pulse (blue bar) that appeared with variable latencies after the stimulus. (F) In P2b::CreBAC1;Atoh1lox/lox mutants, ΔF/F responses to light are limited to a few cells in the RTN and nVII (left panel). Right panel, at top, integrated activity of C4 showing the reduced frequency of the C4 rhythm and systematic failures of photostimulation (blue bars) to evoke C4 responses; bottom, close-up of spontaneous C4 bouts of activity (Spont.) and lack of response to light (blue bar).

