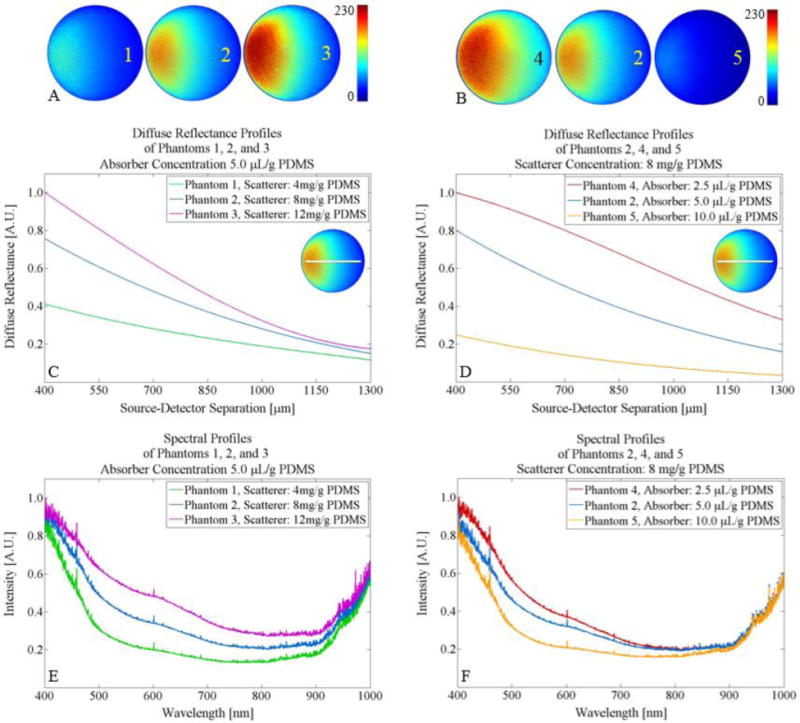
Figure 4.

Quantification of the diffuse reflectance profiles and diffuse reflectance spectra acquired by the DRSME showing (A) diffuse reflectance profiles of Phantoms 1–3 with increased concentration of TiO2, (B) diffuse reflectance profiles of Phantoms 4, 2, and 5 with increased concentration of 1% w/v nigrosin/EtOH, (C) comparison of the diffuse reflectance of Phantoms 1–3 between 400 and 1300 μm from the center of the 635 nm delivery fiber with an inset of line plot through the image guide, (D) comparison of the diffuse reflectance of Phantoms 4, 2, and 5 between 400 and 1300 μm from the center of the 635 nm delivery fiber with an inset of line plot through the image guide, (E) DRS comparison of Phantoms 1–3 between 350–1000 nm, and (F) DRS comparison of Phantoms 4, 2, and 5 between 350–1000 nm.
