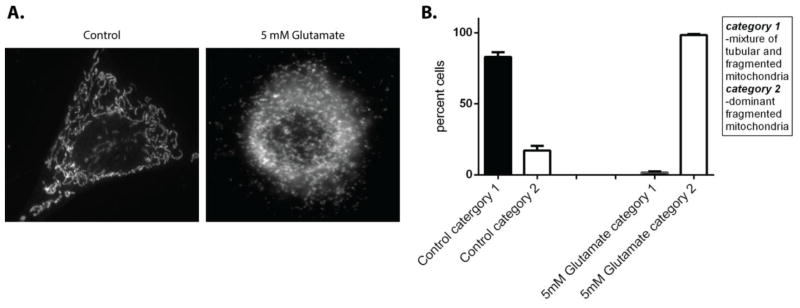
Figure 2. Glutamate treatment increases mitochondrial fragmentation.

The gross mitochondrial morphology of HT22 cells that were exposed to 5 mM glutamate for 10 hours were compared to control. Cells were classified according to gross mitochondrial morphology following staining mitochondria with primary antibody directed against ATP synthase (A). Cells that contained mitochondria that were tubular and fragmented were labeled as category 1, cells that had a dominant fragmented mitochondrial phenotype were labeled as category 2. In control cells 82% of the cells had a mixed tubular and fragmented phenotype, whereas following 5mM glutamate treatment 98% of cells had a dominant fragmented mitochondrial phenotype (B).
