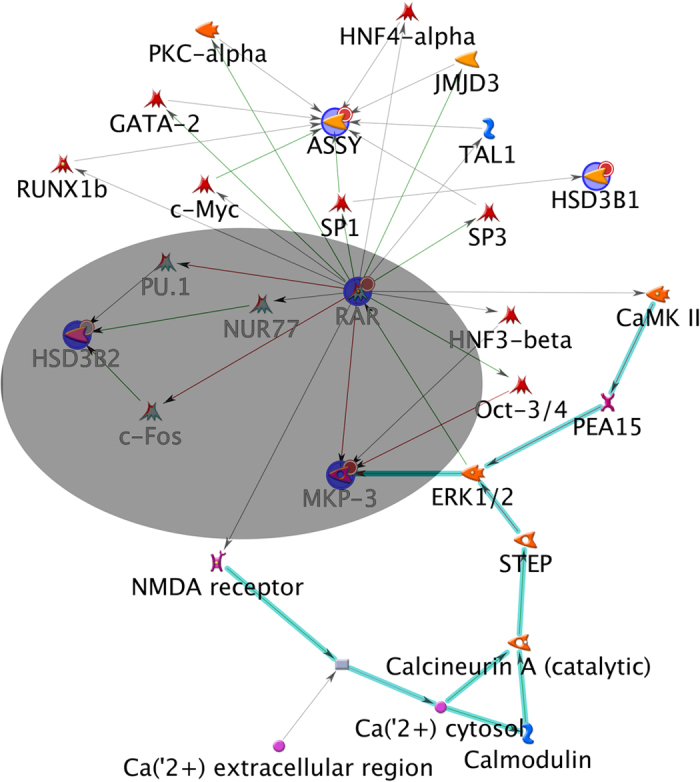
Figure 5.

Network analysis of differentially expressed genes in starvation conditions. GeneGo Metacore software was used to analyze the microarray data for common gene networks between significantly changed genes. Five genes were found in a possible common network, namely HSD3B2, RAR, ASSY, MKP3 (DUSP6) and HSD3B1. The center of this network consists of the RAR gene which links to HSD3B2 through Nur77, and MKP3 seems in a relationship with RAR and ERK1/2. The core of the identified network is highlighted in grey. Only down-regulated genes were found in this network and they are highlighted in blue and marked with small red circles. Green lines show activating relationships; red lines show inhibition; gray lines show relationships of unknown quality; turquoise bold lines connect members of the RAS superfamily.
