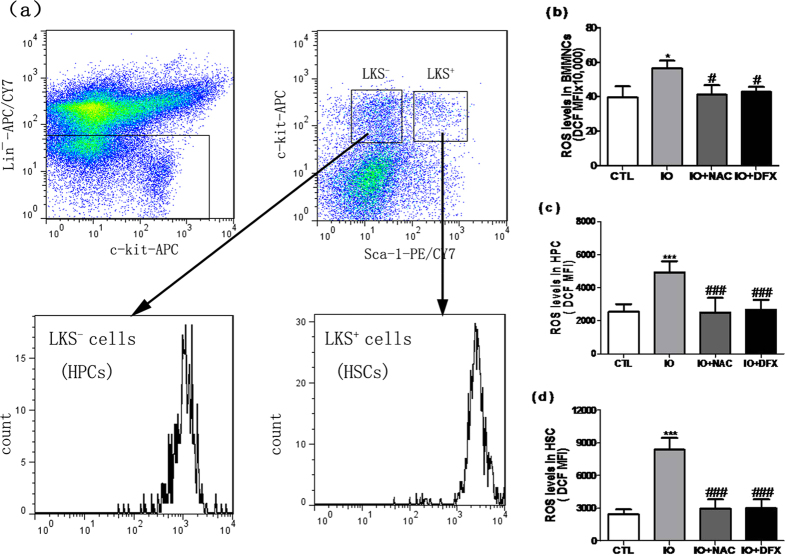
Figure 6. Iron overload enhanced intracellular ROS production.
(a)A representative flow cytometric ROS analysis using DCF staining in HSCs and HPCs is shown. (b–d) The ROS levels in the BMMNCs, HPCs and HSCs are presented as the means ± SE of the DCF MFI from three independent experiments. N = 5 mice/group. *P < 0.05, ***P < 0.001 vs. CTL; #P < 0.05, ###P < 0.001. vs. IO.

