
Table 1.
Identification of differentially accumulated proteins in garlic (Allium sativum L.) sprouts subjected to low-temperature conditioning.
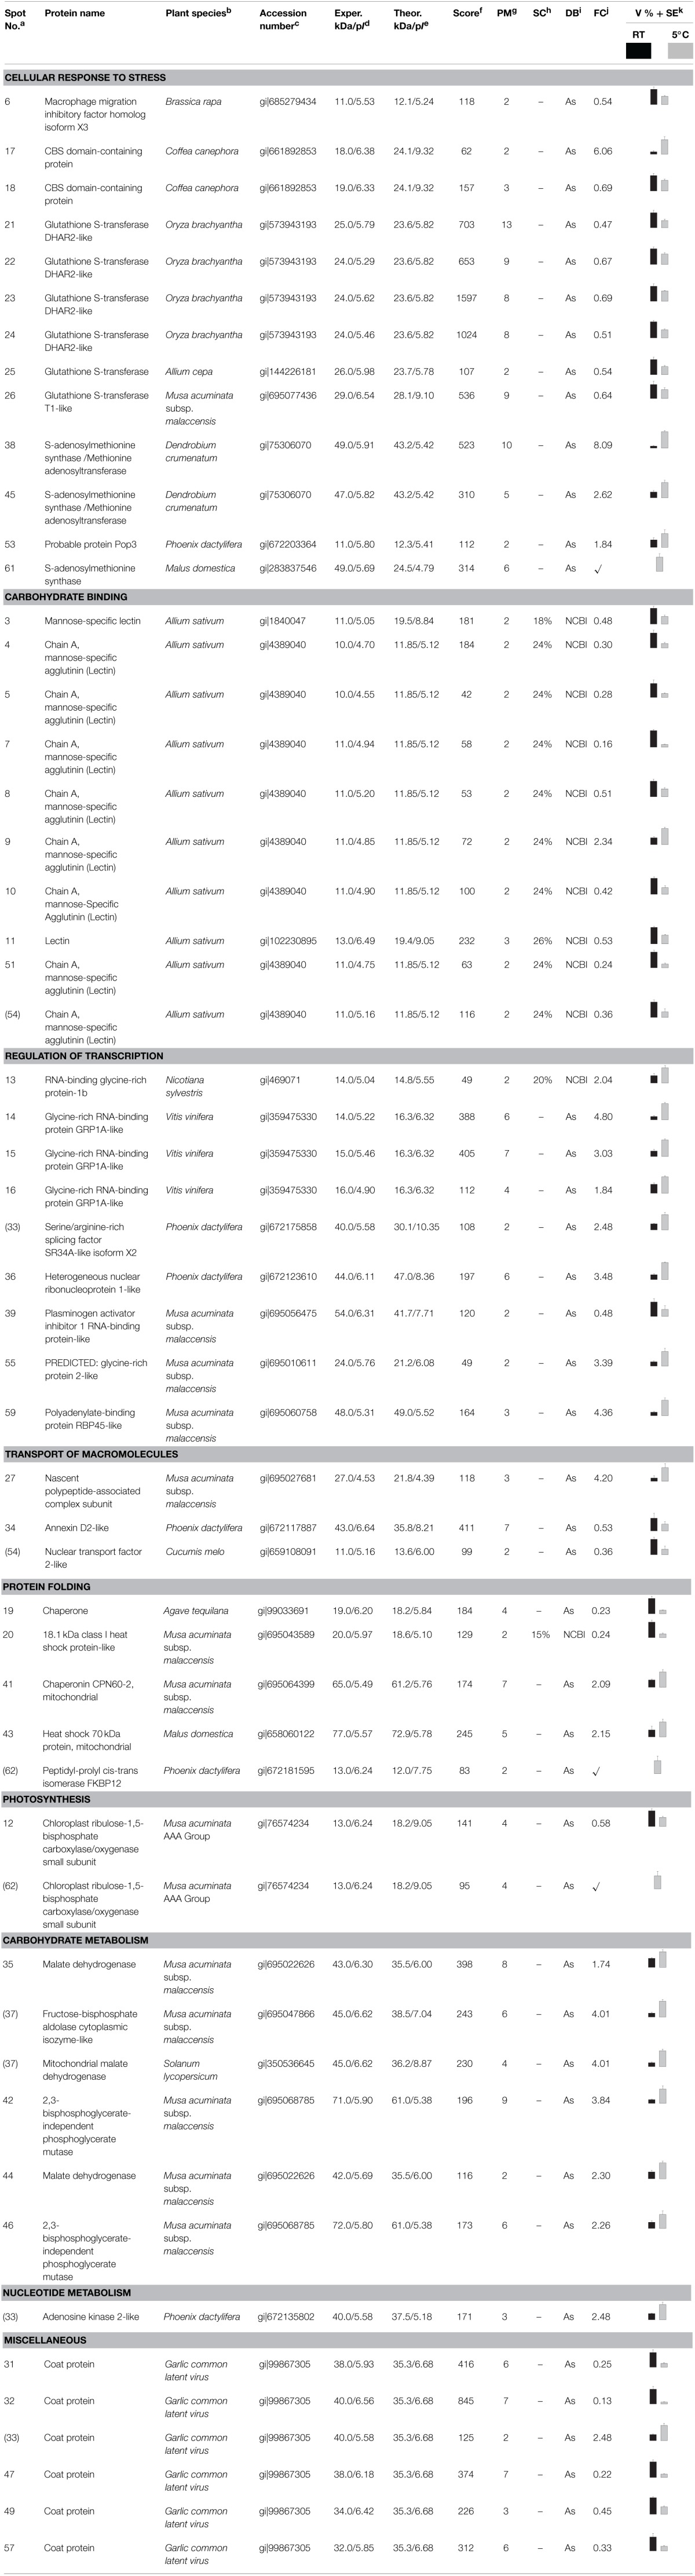
a Spot numbers as indicated in Figure 1; spot numbers in parentheses indicate that the same spot matched to distinct proteins. b Plant species represent the most likely orthologous organisms reported in the NCBInr protein database. c Accession numbers according to NCBInr databse. When the best matches were against the Allium sativum subset of the NCBInr EST database, the most likely orthologous obtained after BLASTX against the NCBInr protein database are reported. d Experimental mass (kDa) and pI of identified protein spots. e Theoretical mass (kDa) and pI of identified proteins retrieved from NCBInr database or after calculation using the compute pI/Mw tool (http://web.expasy.org/compute_pi/). f Mascot score reported after database search. Individual ion scores >23 (for the Allium sativum subset of the NCBInr EST database) or >39 (for the Viridiplantae subset of the NCBInr protein database) are statistically significant (p < 0.05). g Number of peptides matched. h Sequence coverage. i Database. As, Allium sativum subset of the NCBInr EST database; NCBI, Viridiplantae subset of the NCBInr protein database. j Fold change is expressed as the ratio of the volume % between low-temperature/room-temperature conditioned sprouts, and each value represents the mean value of three biologically independent replicates analyzed by duplicate. For some spots, fold change cannot be accurately calculated because of a complete absence of the spot in room temeprature conditioned samples; this is noted by the symbols ✓, indicating the presence of the spot only in low-temparature conditioned samples. k Protein spot accumulation changes in Allium sativum sprouts proteins conditioned at room (23°C) or low-temperature (5°C) for 5 weeks. Each column represents the mean value of three biologically independent replicates analyzed by duplicate. Error bars indicate ± standard error (SE).