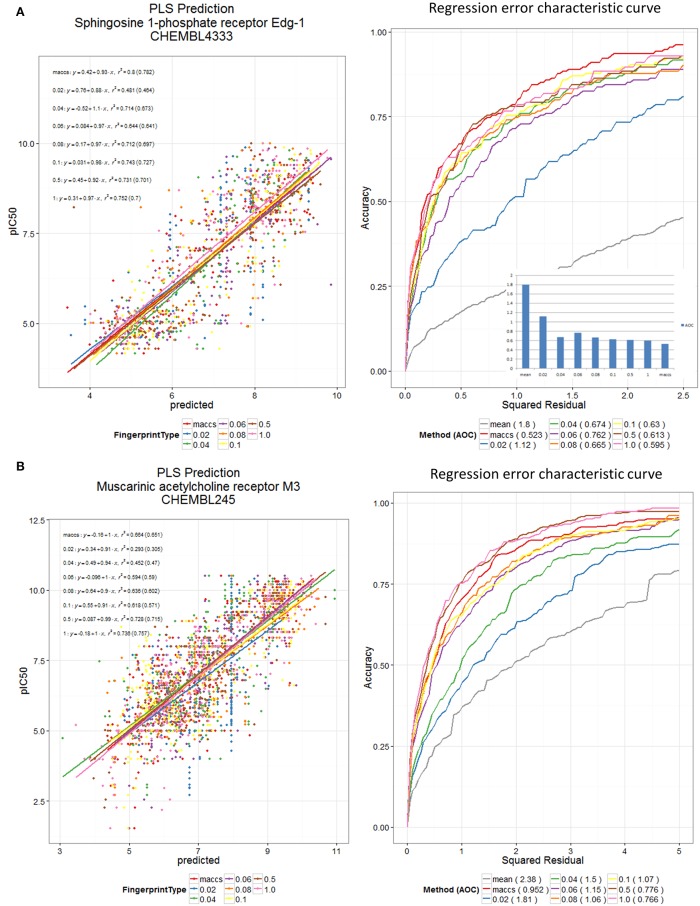
Figure 10.
DES and MACCS encodings predict receptor binding in ChEMBL datasets. PLS Prediction of (A) the ChEMBL 4333 and (B) the ChEMBL 245 dataset pIC50 values using DES Fingerprints (for various fractions, N, of scaffolds used) and MACCS Fingerprints. Scaffolds were sorted according to maximum of their (frequency of occurrence in Drugs, frequency of occurrence in Recon2 metabolites). Datasets were split 60:40 into training and test sets, and training data were pre-processed using a low variance filter, and a correlation filter prior to PLS (5 latent variables). The test data were used for plotting the scatter plot and the REC curve. PLS was carried out using the R plsdepot package using the Knime R Integration and Scripting Nodes. The REC curve plot also shows the curve for using the mean value as predictor; this is taken as a reference worst-case method.

