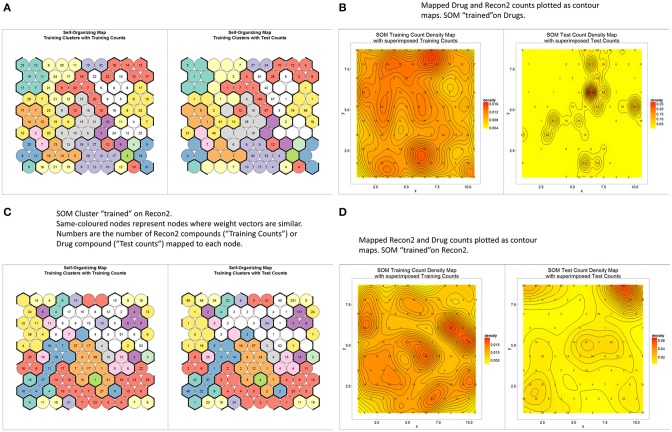
Figure 5.
Relationships between endogenite and marketed drug spaces as judged by self-organizing feature maps trained on marketed drugs as encoded with the MACSS encoding. (A) A self-organizing map with 100 nodes and 10 clusters, trained to convergence (3000 iterations) (left), along with a projection of endogenites onto the trained network (right). (B) The data in A replotted as a contour plot. (C) A plot as in (A) but the network was trained using the Recon2 endogenite data. (D) Contour plot of the data in (C).

