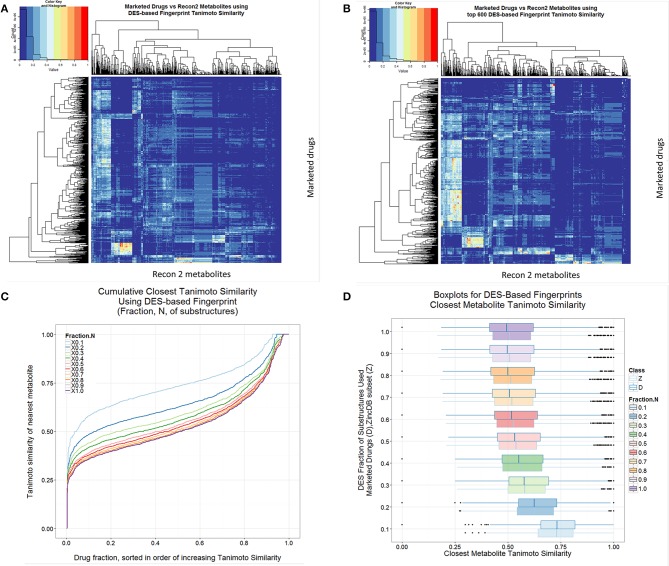
Figure 8.
Drug-endogenite similarities as judged using the DES encoding. (A) Heat map of endogenites vs. drugs with full DES encoding. (B) As A but with the most frequent 600 substructures (1DES600). (C) Cumulative plot of endogenite-likeness using DES encodings based on the fraction of total substructures ordered (from right to left) from the most frequent to least frequent. (D) Boxplots of nearest Tanimoto similarities of drugs to endogenites or to ZINC database subsets as the fraction of the DES encoding was varied.

