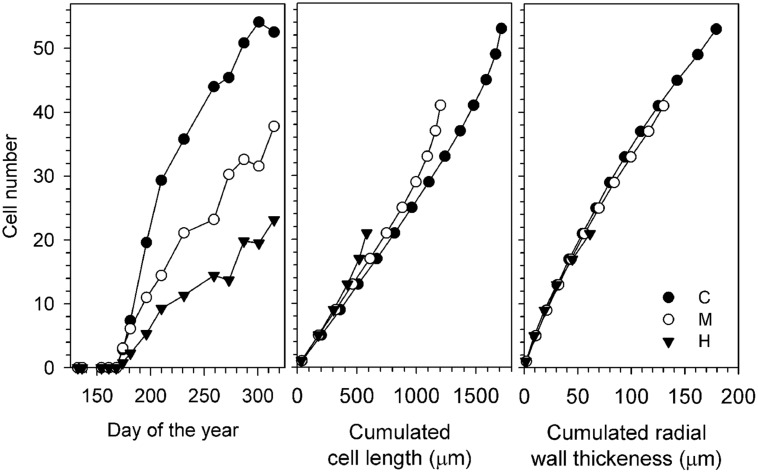
FIGURE 3.
Wood formation during the 2011 growing season for the three study sites: increase in the number of cells (Left) and anatomical component represented by cumulated cell length (Center, μm) and cumulated radial wall thickness (Right, μm). H, heavily defoliated trees; M, moderately defoliated trees; C, control trees.

