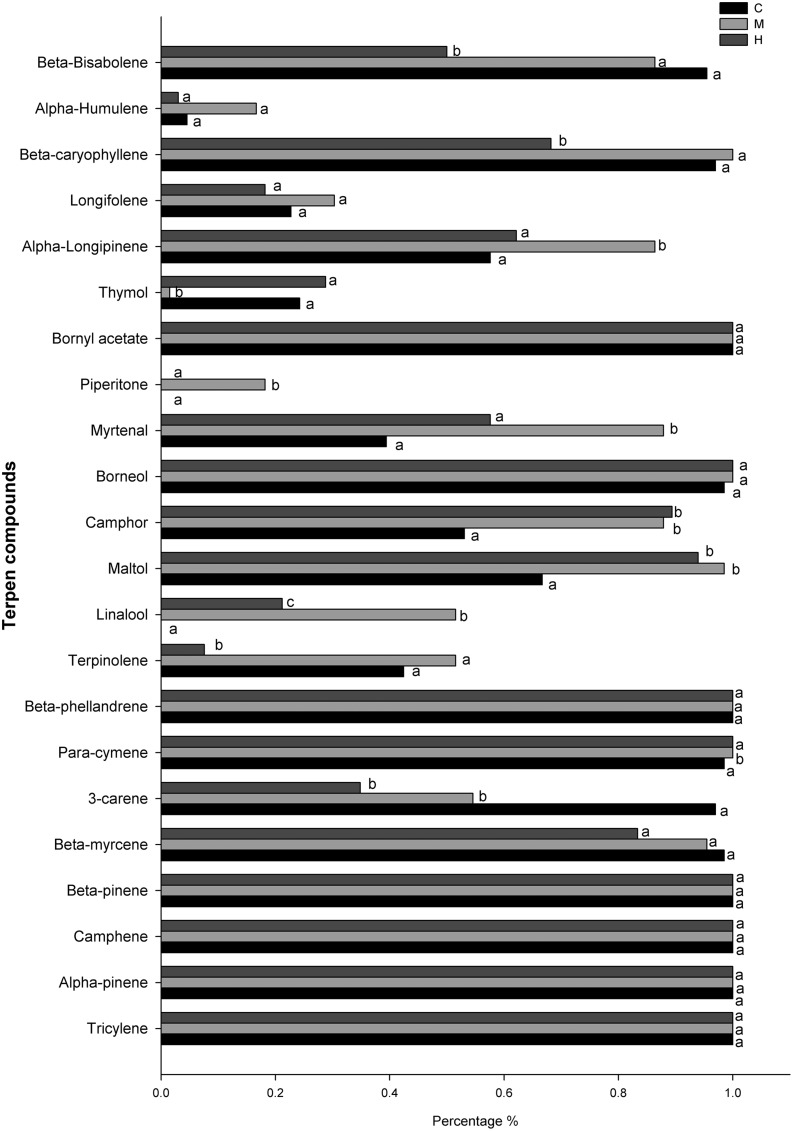
FIGURE 6.
Percentage of occurrence (presence) of defense compounds in the needle among all sampling dates for the different defoliation classes (C, control trees; M and H are moderately and heavily defoliated trees). Different letters (a, b, c) indicate a significant difference (p < 0.05) between defoliation intensity.

