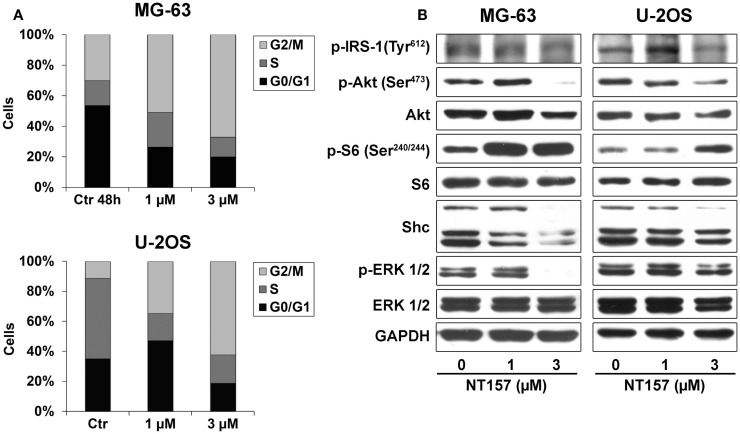
Figure 3.
(A) Analysis of NT157 effects on cell cycle after 48 h of treatment (1–3 μM) in MG-63 and U-2OS OS cell lines. Columns show the mean percentage of cells in different cell cycle phases as measured by flow cytometry. (B) Analysis of major downstream signaling of IRS-1 after treatment with or without NT157 (1–3 μM) by western blotting using 40 μg of total protein cell lysate. GAPDH was used as a loading control. The figure shows data representative of two independent experiments.

