. 2015 May 13;6:562. doi: 10.3389/fpsyg.2015.00562
Copyright © 2015 Wang, Williamson and Meltzoff.
This is an open-access article distributed under the terms of the Creative Commons Attribution License (CC BY). The use, distribution or reproduction in other forums is permitted, provided the original author(s) or licensor are credited and that the original publication in this journal is cited, in accordance with accepted academic practice. No use, distribution or reproduction is permitted which does not comply with these terms.
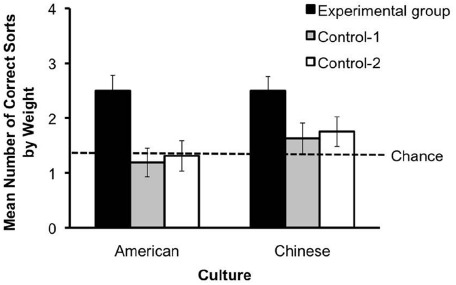
FIGURE 2.

Mean number of weight sorts (±SE) as a function of test group and culture.
