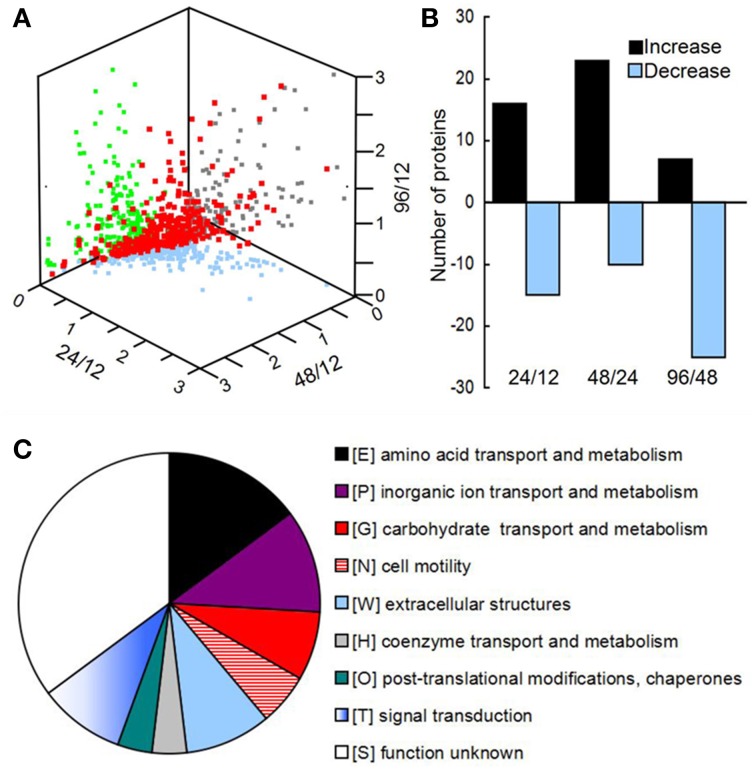
Figure 2.
(A) Three-dimensional diagram representing the distribution of all identified proteins using the abundance ratios between different phases as the X-, Y-, and Z-axes, respectively. In total, 389 proteins were quantified, of which 54 showed significant changes among the different phases. (B) The numbers of proteins with different abundances from 12 to 24 h, 24 to 48 h, and 48 to 96 h. (C) Clusters of orthologous groups (COGs) of proteins with different abundances in the matrix during biofilm development.

