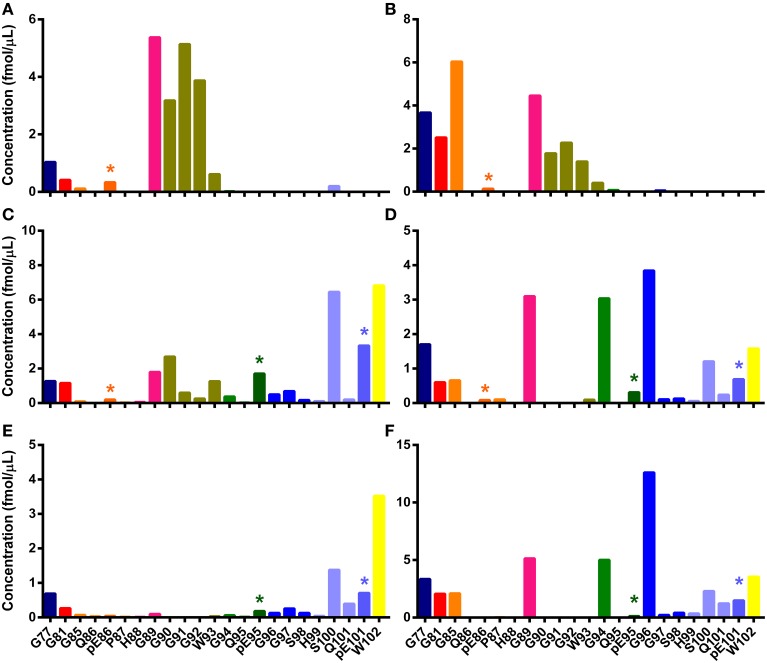
Figure 4.
N-TAAPs from ovine TSEs. Graphs show calculated concentrations (±SD) of N-TAAP peptides determined by chip-HPLC SRM mass spectrometry of digest preparations from the brain stem of individual animals. (A,B) Classical scrapie: VRQ/VRQ Swaledale, neutered male, homebred; (C,D) Experimental CH1641 scrapie: AHQ/AHQ Cheviot, neutered male; (E,F) Experimental BSE: ARQ/ARQ Romney. (A,C,E) without proteinase K treatment; (B,D,F) with proteinase K treatment. Asterisks are used to point out the peptides with pyroglutamyl N-termini.

