
Figure 3.
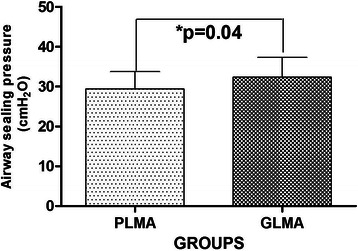
Comparison of airway sealing pressure in two groups (G-LMA vs. P-LMA). Results are given as means ± SD,*p < 0.05.
Official websites use .gov
A
.gov website belongs to an official
government organization in the United States.
Secure .gov websites use HTTPS
A lock (
) or https:// means you've safely
connected to the .gov website. Share sensitive
information only on official, secure websites.
Comparison of airway sealing pressure in two groups (G-LMA vs. P-LMA). Results are given as means ± SD,*p < 0.05.