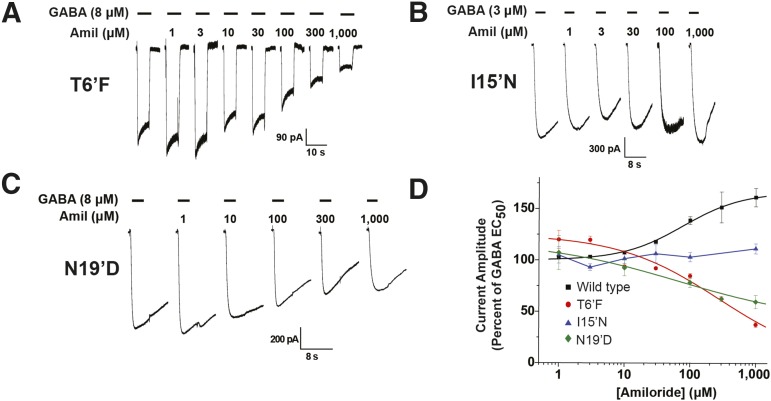
Fig. 3.
Human GABA-A ρ1 receptor containing the TM2 6′, 15′, and 19′ mutations display altered response profiles to amiloride. Comparison of amiloride response profile of wild-type hGABA-A ρ1 and hGABA A ρ1 T6′F, I15′N, or N19′D mutant receptors. All constructs were transiently expressed in HEK293T cells. (A) Representative traces of hGABA-A ρ1 T6′F mutant receptor currents elicited upon coapplication of 8 μM GABA (EC50) with increasing concentrations of amiloride. (B) Representative traces of hGABA-A ρ1 I15′N mutant receptor currents elicited upon coapplication of GABA EC50 (3 μM) with increasing concentrations of amiloride. All activation currents generated by applying GABA and amiloride test solutions for 5 seconds. (C) Representative traces of hGABA-A ρ1 N19′D mutant receptor currents elicited upon coapplication of GABA EC50 (8 μM) with increasing concentrations of amiloride. (D) Comparison of normalized concentration-response profiles of amiloride inhibition in wild-type hGABA-A ρ1 and hGABA-A ρ1 I15′N, hGABA-A T6′F, and hGABA-A N19′D mutant receptors compared with control the respective control concentration of GABA. The determined amiloride EC50 was 44.57 ± 14.24 μM for the wild-type hGABA-A ρ1 receptor. IC50 values of 277.3 ± 88.6 μM with a Hill coefficient of 1.2 ± 0.3 and 66.4 ± 9.4 μM with a Hill coefficient of 0.4 ± 0.02 were obtained for hGABA-A ρ1 T6′F and hGABA-A ρ1 N19′D mutant receptor, respectively. The hGABA-A ρ1 I15′N mutant receptor displayed an absence of amiloride modulation, and thus no EC50 or IC50 was obtained. Data are presented as the mean ± S.E.M., with a sample size of n ≥ 5 cells.

