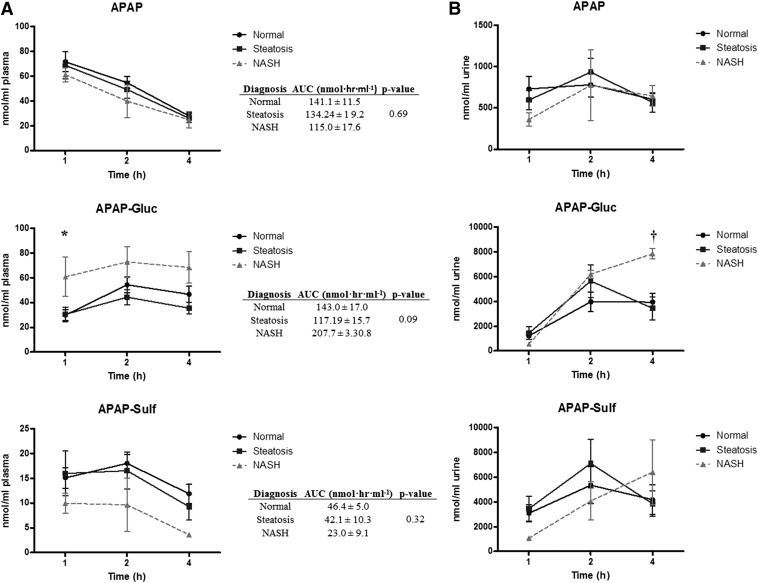
Fig. 1.
Plasma and urine APAP, APAP-gluc, and APAP-sulf in pediatric NAFLD. Plasma (A) and urine (B) concentrations of APAP, APAP-gluc, and APAP-sulf after a single oral administration of 1000 APAP. Samples were collected at 1, 2, and 4 hours postdosing and measured by HPLC-UV. Area under the plasma versus time curve (AUC) for APAP, APAP-gluc, and APAP-sulf were calculated for all three diagnosis stages and are provided as an insert to (A). P values provided for the AUC data represent the calculated ANOVA P value across all three diagnosis stages. *P < 0.05 healthy patients compared with NASH patients; †P < 0.05 patients with simple steatosis compared with NASH patients.

