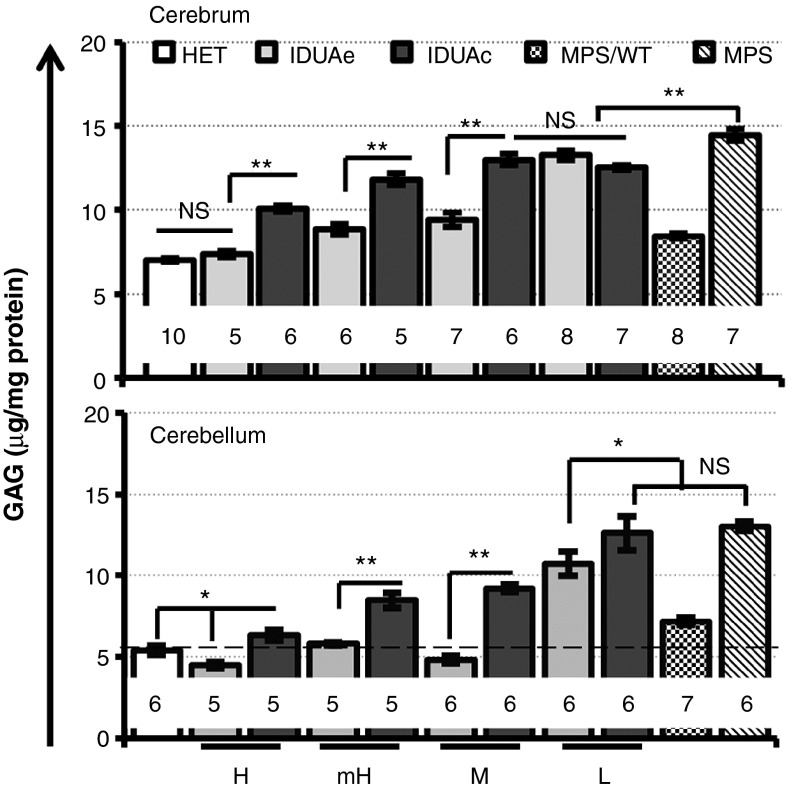
Figure 4.
Metabolic correction in MPS I cerebrum and cerebellum of IDUAe-treated animals. Two pieces of forebrain cortex or one piece from the left cerebellum dissected from perfused animals were tested for GAG levels. N for each group is indicated under each bar; dotted line represents mean of GAG levels in normal HET animals. Error bars represent SEM. *P < 0.05; **P < 0.001; NS, no significance. HET, heterozygote; IDUA, α-l-iduronidase; MPS I, mucopolysaccharidosis type I.

