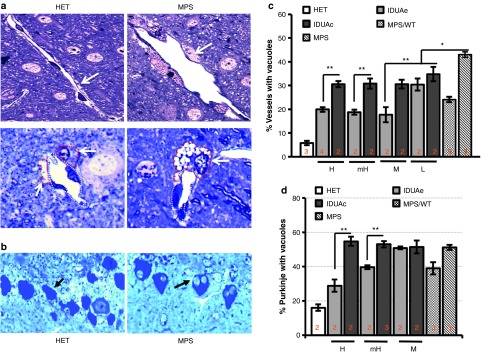
Figure 5.

Improvement in pathology of cerebrum and cerebellum among different dosage groups of MPS I animals treated with IDUAe or IDUAc. Histopathology analysis of (a,b) forebrain cortex and (c,d) cerebellum was performed in Epon-embeded tissue sections (0.5 µm) with toluidine blue staining. (a) Representative images showing brain large vasculatures (top) or microvasculatures (bottom). Dotted lines outline either brain vascular endothelia cells (white) or perivascular cells (red) (arrows). (b) Percentages of blood vessels that are associated with vacuolated perivascular cells in forebrain. (c) Representative images of cerebellum showing Purkinje cells (arrow) without or with one or more large vacuoles. (d) Percentages of vacuolated Purkinje cells. The scoring data are shown as mean ± SD from >6 sections of 2–4 slides of 2–4 mice per group, and the percentages of all sections contributed to statistical analysis. *P < 0.05; **P < 0.001; NS, no significance. IDUA, α-l-iduronidase; MPS I, mucopolysaccharidosis type I.
