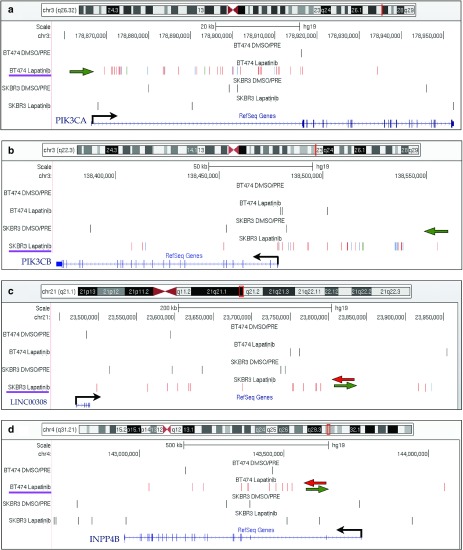
Figure 2.
Representative CIS in the lapatinib-selected dataset. The UCSC Genome Browser snapshots are shown for four representative CIS. (a) PIK3CA on chromosome 3 was targeted by 38 integrations in a 65 Kb window. All the integrations were located in the first intron of the gene, upstream of the first coding exon. Thirty-six of 38 integrations were orientated in sense with the transcription of the gene (which is shown by a black arrow). A green arrow sketches the marked orientation preference of integrations. (b) PIK3CB on chromosome 3 was targeted in SKBR3 cells by 31 integrations clustered in a 147 Kb window upstream of the gene with marked orientation preference (green arrow). C) LINC00308 on chromosome 21, identified as a CIS in SKBR3 cells, is a noncoding RNA gene targeted by integrations without orientation preference, sketched by green and red arrows pointing in opposite directions. (d) INPP4B on chromosome 4, identified as a CIS in BT474 cells, was targeted by intragenic insertions without orientation preference. In each panel, the genomic region showed in the snapshot is highlighted on top of the chromosome outline as a red vertical bar. Integrations are shown as colored vertical bars in each dataset (from the top: BT474 DMSO/PRE controls, BT474 lapatinb-selected cells, SKBR3 DMSO/PRE controls and SKBR3 lapatinib-selected cells). For the integrations in selected samples, red, blue and green bars indicate that they have been retrieved from cell population transduced at high, intermediate and low multiplicity of infection (MOI), respectively. For SKBR3, high MOI = 100, intermediate MOI = 10, low MOI = 1: for BT474 high MOI = 50, intermediate MOI = 5, low MOI = 0.5. A purple line underscores the dataset in which this CIS was identified. The succession of introns (lines) and exons (filled squares) of the gene(s) is shown in blue on the bottom of the panel.

