
Figure 10.
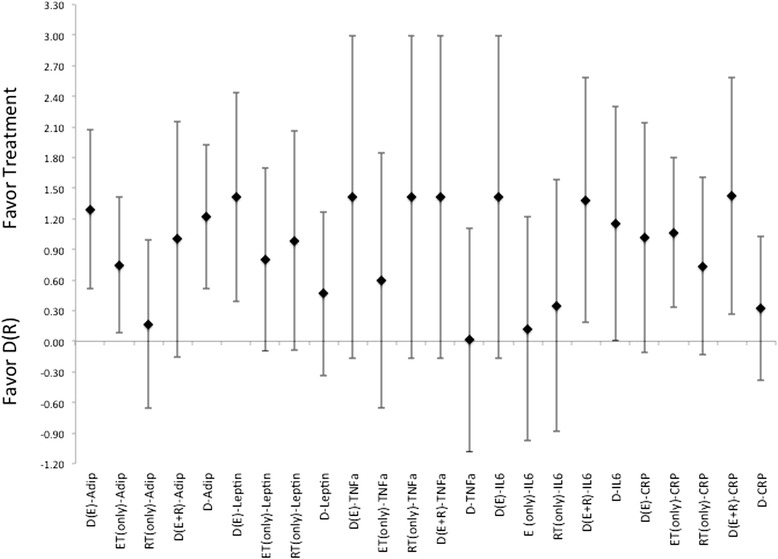
Description of the pooled ES for treatment response and the range of CI for ES between intervention (versus diet with combination of RT) methods for response related to changes in Adiponectin, Leptin, CRP, TNF- α and IL-6. Note that labeled groups go as follows: D indicating diet-only, D(E) indicating diet with ET, D(R) indicating diet with RT, and D(E + R) indicating diet with ET and RT for the various intervention methods within the comparisons.