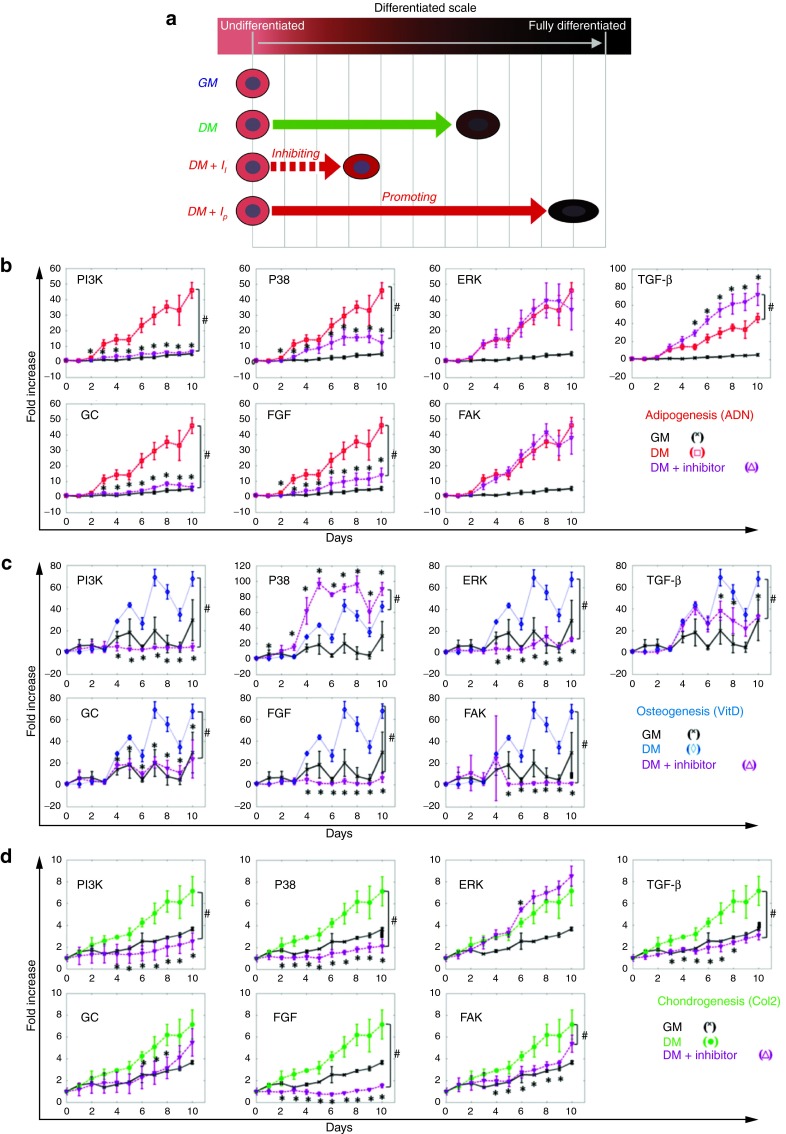
Figure 4.
Response of P/RE reporters during pathway inhibition. (a) Schematic of experimental design. (b–d) Dynamics of P/RE activity during adipogenic (red lines, □), osteogenic (blue lines, ◊), or chondrogenic (green lines, •) differentiation in the presence or absence of the indicated chemical inhibitor (I). Purple (Δ) and black lines (x) represent the response of cells in DM+I and GM, respectively. Normalized fluorescence intensity was plotted as fold-increase over day 0, when differentiation was induced. All values represent the mean ± SD of triplicate samples in a representative experiment (n = 3). * denotes P < 0.05 between DM+I and DM as calculated by t-test; and # denotes P < 0.05 between DM+I and DM as calculated by the AUC method.

