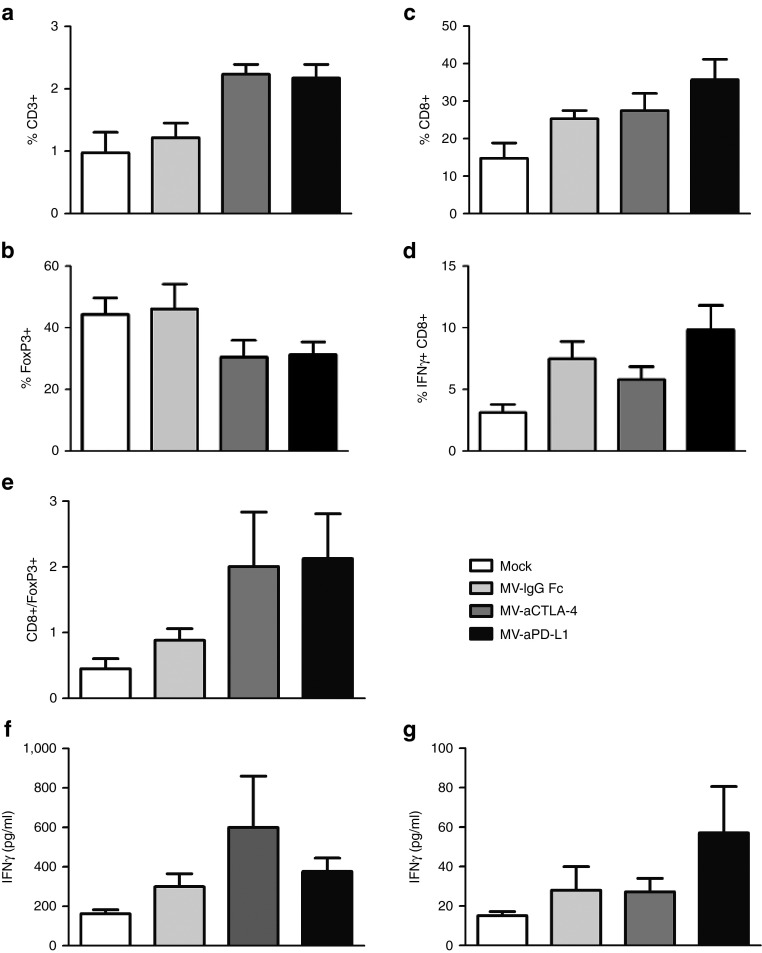
Figure 3.
Tumor-infiltrating lymphocytes and IFNγ response after immunovirotherapy. 1 × 10⁶ B16-CD20 cells were implanted subcutaneously into the flank of C57BL/6 mice and treated with five intratumoral injections of mock treatment, MV-IgG Fc, MV-aCTLA-4, or MV-aPD-L1 (n = 6 each). Tumors were explanted and splenocytes were isolated 24 hours after the last treatment. Single cell suspensions were prepared and tumor-infiltrating lymphocytes were analyzed by flow cytometry. Mean values are shown; error bars indicate standard error of the mean. (a) Percentage of CD3+ T cells among all cells. (b) Percentage of CD25+ FoxP3+ regulatory T cells among all CD4+ cells. (c) Percentage of CD8+ among all CD3+ T cells. (d) Percentage of IFNγ+ within total CD8+ T cells. (e) Ratios of CD8+/FoxP3+ cells. (f) Splenocytes harvested 24 hours after the last treatment (“early”) were cocultivated with B16-CD20 tumor cells. Cell culture supernatants were collected after 24 hours and IFNγ concentration was determined by enzyme-linked immunosorbent assay (ELISA). Mean values (n = 4 per group) are shown. Error bars represent standard error of the mean. (g) Splenocytes were isolated when tumors reached a volume exceeding 1,500 mm3 (“late”) and cocultivated with B16-CD20 tumor cells. After 24 hours, IFNγ release was determined by ELISA. Mean values (n = 4 for mock and MV-IgG Fc; n = 5 for MV-aCTLA-4 and MV-aPD-L1) and standard error of the mean are depicted.

