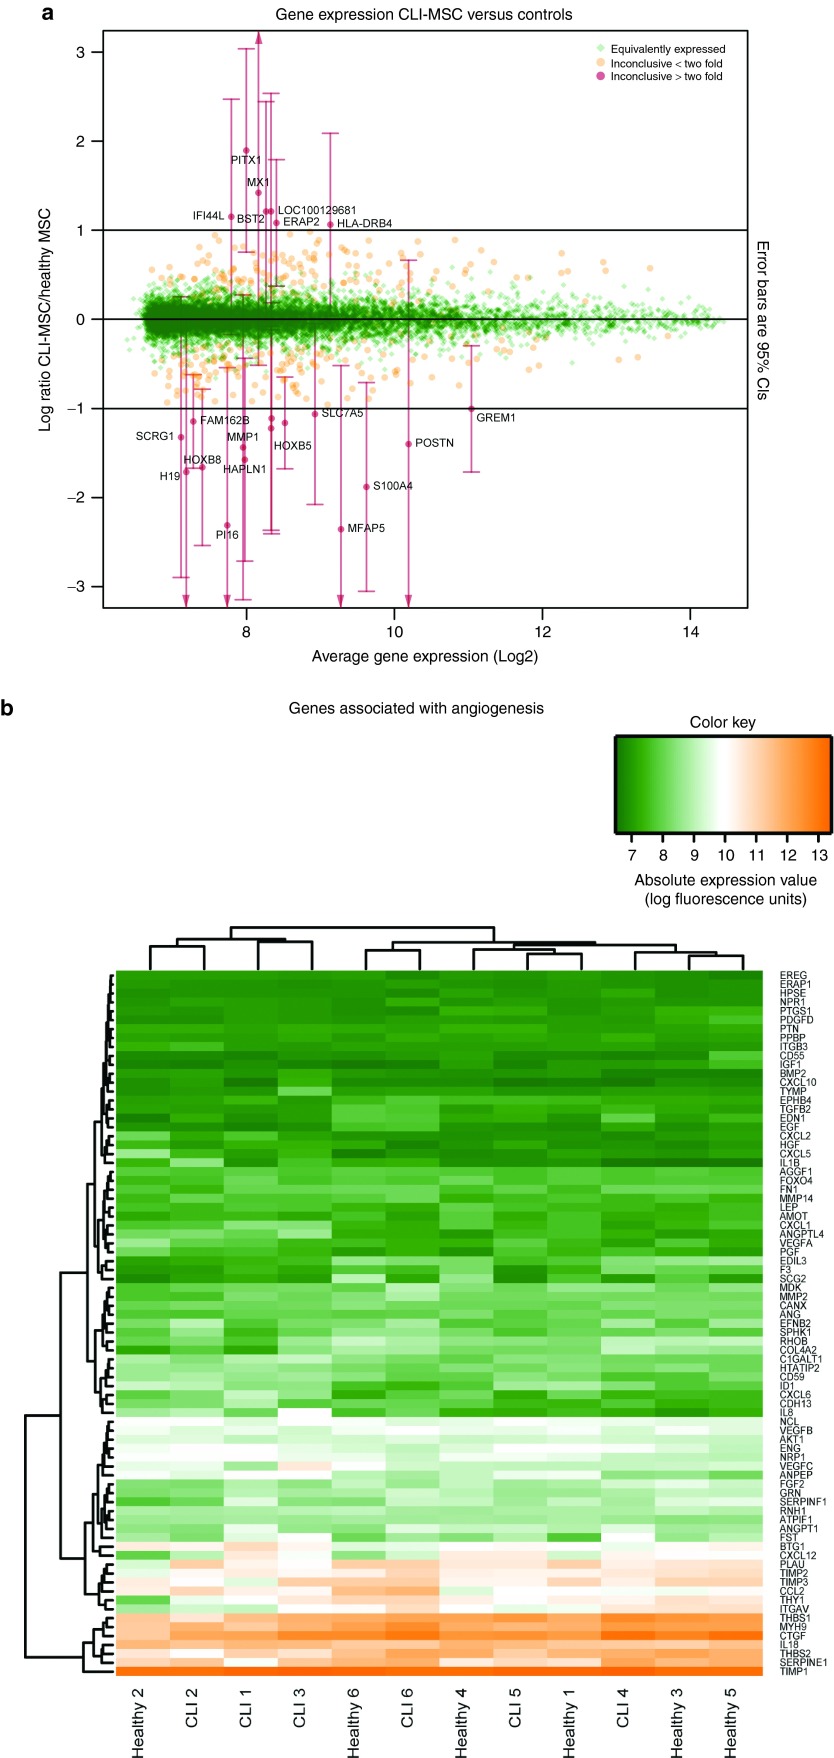
Figure 1.
Gene expression. (a) Relative expression of genes in CLI-MSCs/Control MSCs. On this M/A plot, the x-axis denotes the average expression (in units of fluorescence intensity), the y-axis denotes the ratio of expression in CLI- MSCs/Control MSCs. Expression of genes shown in green is with 95% confidence intervals less than a factor differentially expressed. The remaining genes are inconclusive, genes with an average fold change of >2 are indicated in red and 95% confidence intervals are given. (b) Heatmap showing genes associated with angiogenesis, clustering on columns shows no clear separation between CLI- and Control MSCs.

