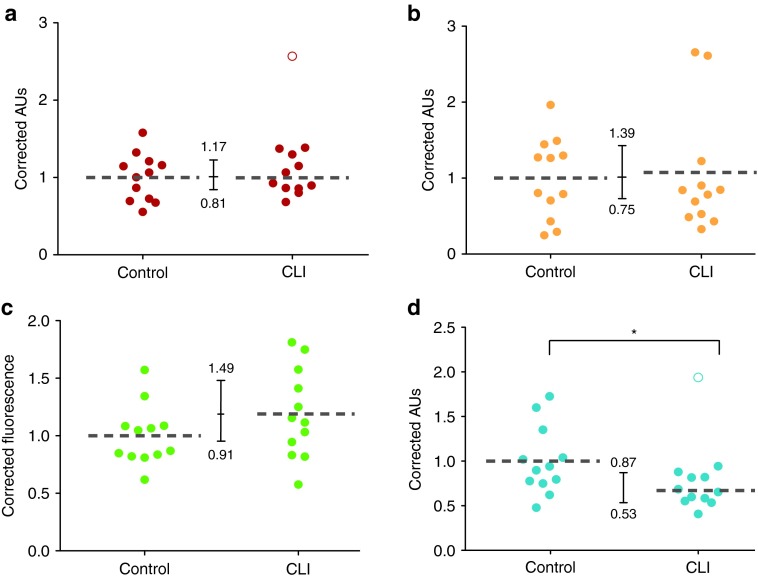
Figure 2.
Differentiation. (a) Quantification of alizarin red retention in osteogenically differentiated MSCs was found to be equivalent; CLI:Control = 0.99 (95% CI = 0.81–1.17), the open circle indicates and outlier that has been left out of analysis. (b) ALP activity in MSCs after osteogenic differentiation; CLI:Control = 1.07, 95% CI = 0.75–1.39. (c) Adipogenic Differentiation measured by Lipidtox Green staining, CLI:Control = 1.2, 95% CI = 0.71–1.49. (d) Chondrogenic differentiation measured by sGAG production. sGAGs levels were significantly lower in CLI-MSCs.

