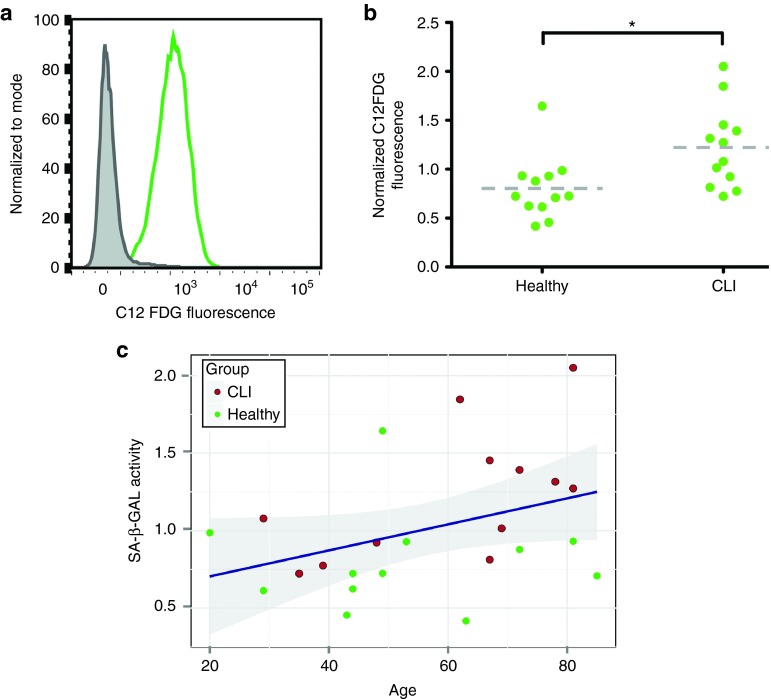
Figure 3.
Senescence. (a) Representative example of SA-β-galactosidase activity as measured by flow cytometry. (b) Senescence is increased in CLI MSCs compared to Healthy controls (P = 0.01). (c) MSC senescence is significantly associated with donor age (P = 0.02), shaded band indicates 95% confidence interval.

