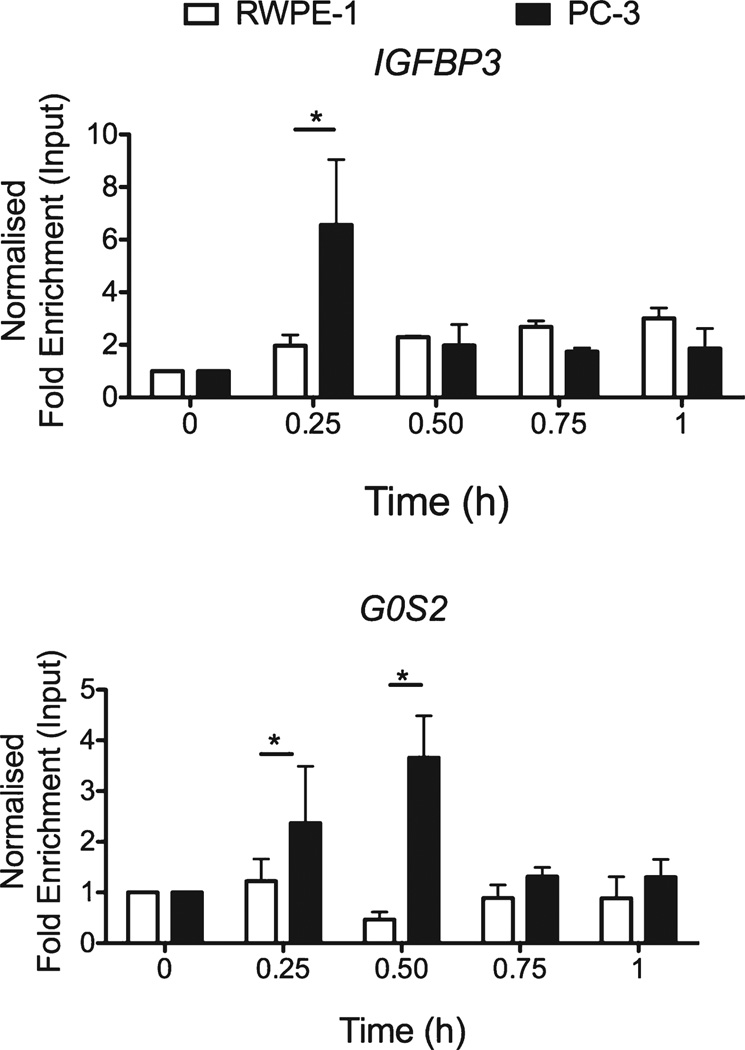
Fig. 2.
NCOR1 differentially associates with target genes. RWPE-1 and PC-3 cells were treated with 1α,25(OH)2D3 (100 nM) or EtOH for indicated time points. Association of NCOR1 was measured at each region using X-ChIP with ChIP grade antibodies and normalized, and given as fold enrichment over input [31]. Enrichment was measured using Q-PCR with primers specific to these regions that amplified products <150 bp. All measurements were performed in technical duplicate and biological triplicate (*p < 0.05, **p < 0.01, ***p < 0.001).

