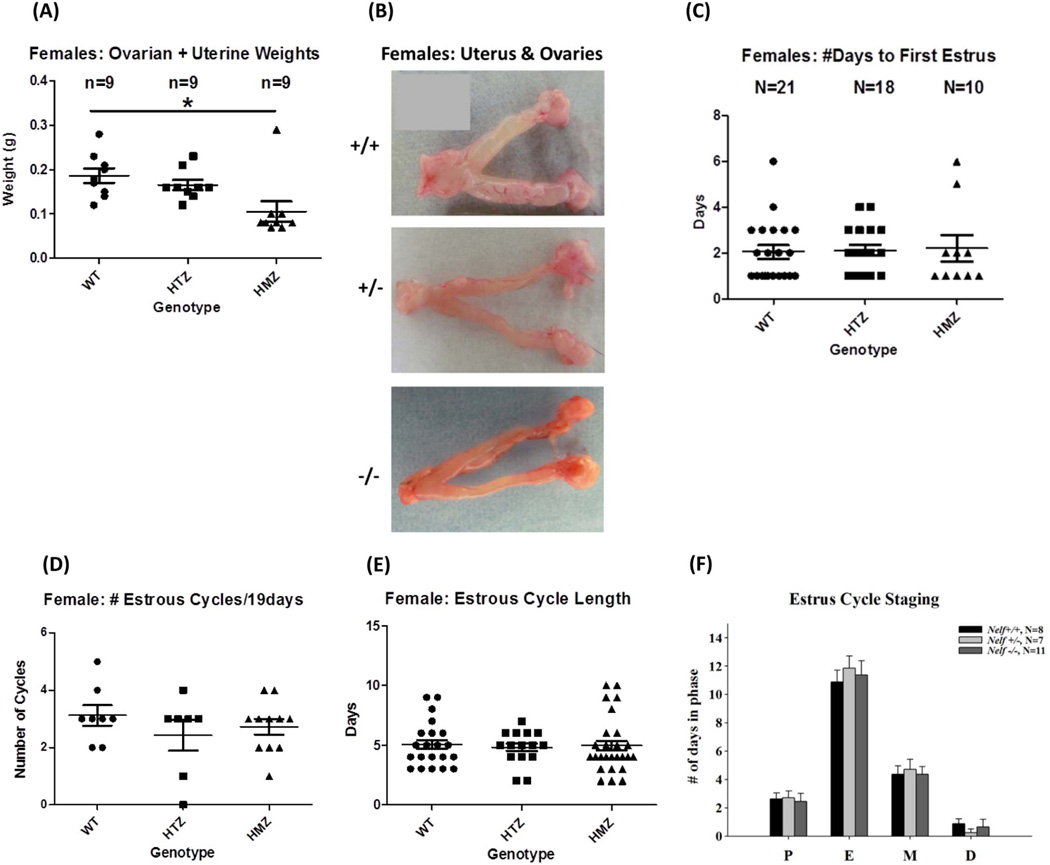
Figure 3. Estrus cycling and fertility in female Nelf KO mice.
(A) Uterine plus ovarian weights were decreased in KO female mice compared to WT (ANOVA with Tukey MCP, P<0.05) when measured during proestrus at 8 weeks of age. (B) Gross structure of the ovaries and uteri is shown. (C) The time to first estrus, (D) the number of estrus cycles/19 days, (E) estrus cycle length, and (F) time spent in each of the four estrous stages were not different in the three genotypes.

