Fig. 3.
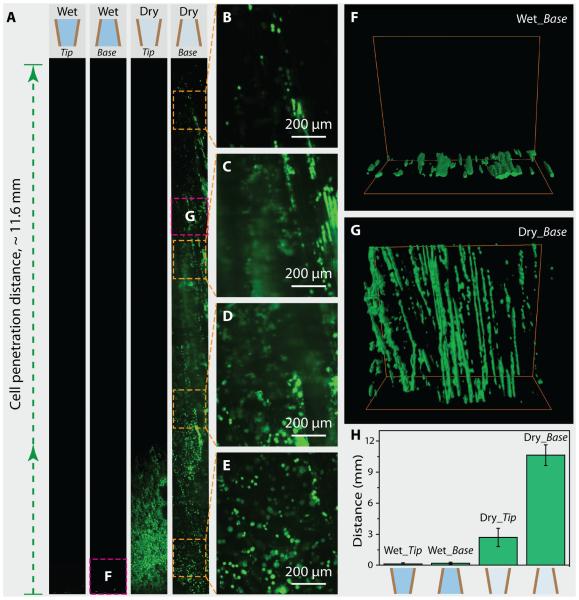
Cell-seeding experiments on wet and dry gradient scaffolds. (A) Fluorescent images of wet and dry scaffolds after seeding cells by contacting tip or base side of the scaffold with cell solution, respectively. Lacking capillary effect, cells adhered only to the outer surface of wet scaffolds pre-perfused with PBS (Wet_Tip and Wet_Base). In contrast, cell solution was driven along the channels within dry scaffolds by capillary force (Dry_Tip and Dry_Base). In the case of Dry_Base, cells penetrated all along the scaffold, which is around 12 mm in length. (B-E) High-magnification fluorescent images showing cells that are loaded all along the scaffold. (F) 3-D confocal fluorescent image showing that cells can only adhere to the edge of the Wet_Base sample without penetration. (G) 3-D confocal fluorescent image showing that cells are deeply loaded into the Dry_Base sample and aligned in the lamellar channels. The scanned locations are also indicated by the squares in (A). (H) Statistical data about the penetration distance of cells in all four experiments, which are 0.12 ± 0.12 mm (Wet_Tip), 0.19 ± 0.12 mm (Wet_Base), 2.7 ± 0.88 mm (Dry_Tip), and 10.63 ± 1 mm (Dry_Base), respectively.

