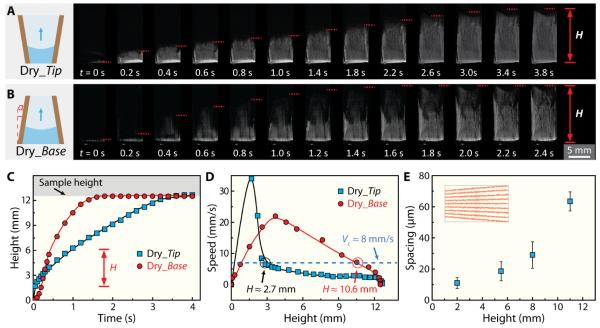
Fig. 4.
Analysis of the driving force for self-seeding of cells within gradient scaffold. (A-B) Sequential optical images showing capillary rise within dry gradient scaffolds with (A) the tip or (B) the base facing down and contacting deionized water. The images were taken with a high-speed charge coupled device (CCD) camera at 500 frames per second. (C) Height of water front (H) during capillary rise as a function of time. In both cases, water completely perfused the entire scaffolds (around 12 mm in length) within 3.5 s. (D) Speed of water front as a function of height. In both cases, the rising speed of water increased right after scaffolds contacted water, and decreased after reaching the maximum velocity. Comparing the penetrating distance of Dry_Tip (2.7 ± 0.88 mm) and Dry_Base (10.63 ± 1 mm) with the speed-height curve, a lowest critical speed of around 8 mm/s was found for the cells to flow with liquid along the channels of scaffolds. (E) Statistical data of lamellar spacing (λ) as a function of height, measured from cross section SEM images.

