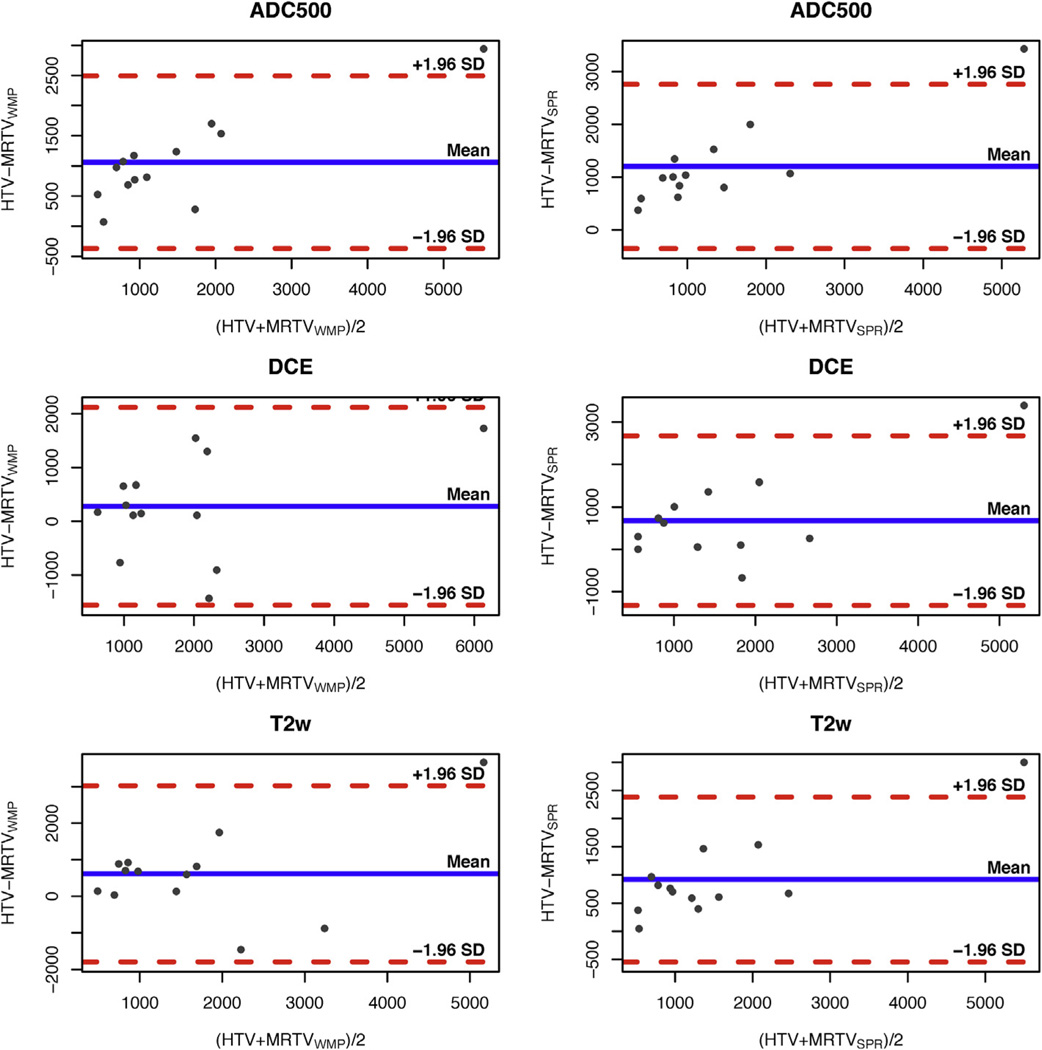
Figure 2.
Bland–Altman plots illustrating the relationship between histology index tumor volume (HTV) in comparison to the volumes estimated on magnetic resonance (MR) imaging after correlation with whole mount pathology (WMP; left column) and surgical pathology report (SPR; right column), for the individual MR parameters. The blue horizontal line corresponds to the mean difference, dashed red lines show 1.96 standard deviation (SD) interval. In all cases, there was a tendency for the imaging-based approaches to underestimate HTV. ADC, apparent diffusion coefficient; DCE, dynamic contrast enhanced; MRTV, magnetic resonance tumor volumes; T2W, T2-weighted imaging.

