
FIGURE 2.
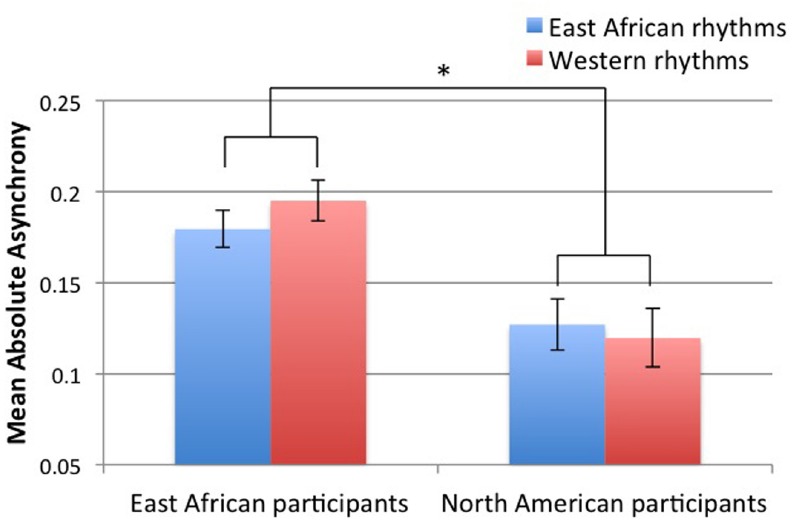
Absolute asynchrony values of beat taps relative to beat positions in the rhythmic stimuli, averaged over each trial and proportionate (divided by) the tapping rate (mean ITI). Error bars indicate (±1 SE of the mean. *p < 0.05 (interaction between group and rhythm type).