
FIGURE 3.
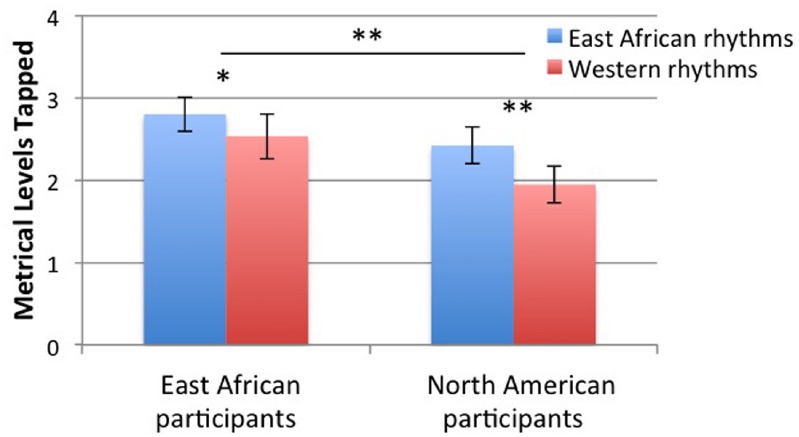
Number of metrical levels tapped. Error bars indicate ±1 SE of the mean. *p < 0.1, **p < 0.05.
Official websites use .gov
A
.gov website belongs to an official
government organization in the United States.
Secure .gov websites use HTTPS
A lock (
) or https:// means you've safely
connected to the .gov website. Share sensitive
information only on official, secure websites.
Number of metrical levels tapped. Error bars indicate ±1 SE of the mean. *p < 0.1, **p < 0.05.