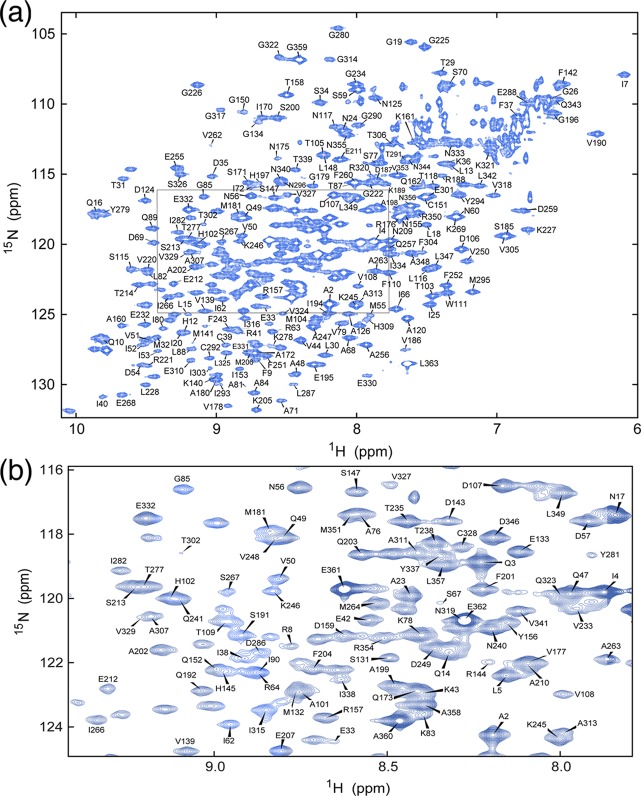
Figure 2.
Backbone sequential resonance assignments of clathrin TD. (a) Two-dimensional 1H–15N TROSY-HSQC spectrum and assignments of the amide resonances. The assignable peaks are labeled by residue number; 90% of the total visible peaks could be assigned. (b) Enlarged view of the area boxed in panel a.

