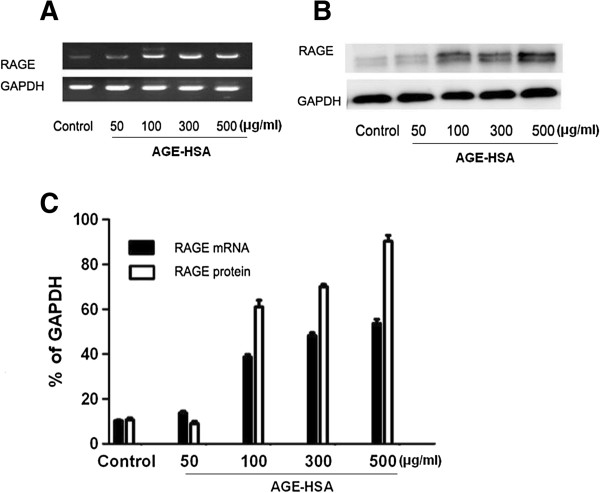
Figure 3.

The effect of AGE-HSA on expression of RAGE. (A) Representative RT-PCR images showing mRNA expression levels of RAGE. (B) Representative Western blot images showing the protein expression levels of RAGE. (C) Densitometric analyses of RT-PCR and Western blots as a percentage of GAPDH expression. Each value is expressed as the mean ± SD of three independent experiments. *p < 0.05 vs. control (HSA 300 μg/ml).
