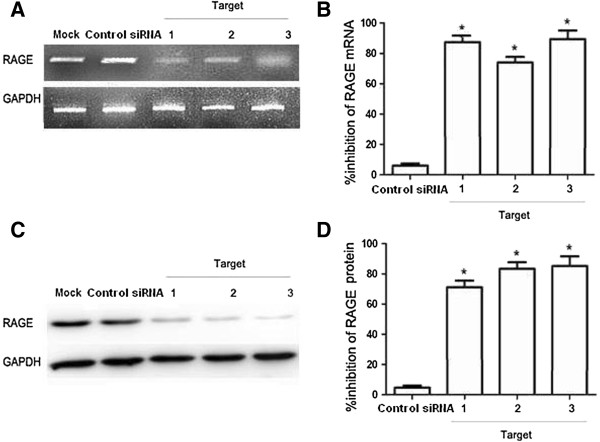
Figure 5.

Knockdown of RAGE mRNA and protein expression levels using siRNA. Serum-starved ADSCs were transfected with different double-stranded siRNAs at a final concentration of 50 nM each. RAGE mRNA and protein expression levels at 48 h after transfection were quantified. (A) Representative RT-PCR experiments illustrating RAGE mRNA expression in ADSCs at 48 h after transfection with different siRNAs. (B) Data shown are the percent inhibition of RAGE mRNA expression levels compared to mock-transfected cells. The mean ± SD of three independent experiments are shown. (C) Representative Western blotting experiment illustrating RAGE protein expression in ADSCs 48 h after transfection with different siRNAs. (D) Data shown are the percent inhibition of RAGE protein expression in ADSCs 48 h after transfection with different siRNAs. The means ± SD of three independent experiments are shown. “Mock” indicates “mock-transfected cells”, meaning cells were only transfected with transfection reagents. *p < 0.05 vs. control siRNAs.
