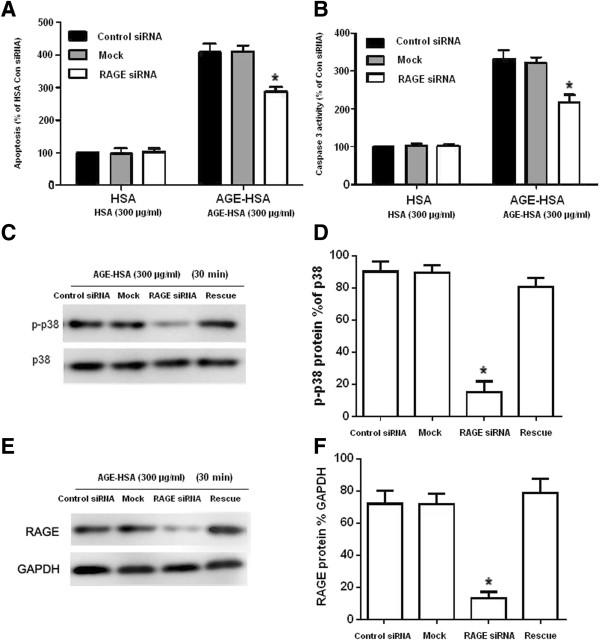
Figure 6.

Effects of RAGE siRNA on p38 MAPK activation in ADSCs induced by AGE-HSA. (A, B) The mock-, control siRNA- and RAGE siRNA-transfected ADSCs were cultured with 300 μg/ml AGE-HSA or HSA for 24 h and then subjected to an ELISA to measure apoptosis and caspse-3 activity. (C) The mock-, con siRNA- and RAGE siRNA-transfected ADSCs were stimulated with 300 μg/ml AGE–HSA for 30 min. Phosphorylation of p38 MAPK was determined by Western blotting. Representative western blot images showing the protein expression of total p38 MAPK and phosphorylated p38 MAPK (p-p38) are shown. (D) Densitometric analyses of the western blots showing the level of p-p38 as a percentage of total p38. Each value is expressed as the mean ± SD of three independent experiments. “Mock” indicates “mock-transfected cells”, meaning cells were only transfected with transfection reagents. “Rescue” indicates cells in rescue condition (RAGE siRNA + RAGE expression). (E) The mock-, con siRNA- and RAGE siRNA-transfected ADSCs were stimulated with 300 μg/ml AGE–HSA for 30 min. Expression of RAGE was determined by Western blotting. Representative western blot images showing the protein expression of RAGE and GAPDH are shown. (F) Densitometric analyses of the western blots showing the level of RAGE as a percentage of GAPDH. Each value is expressed as the mean ± SD of three independent experiments. *p < 0.05 vs. control siRNA.
