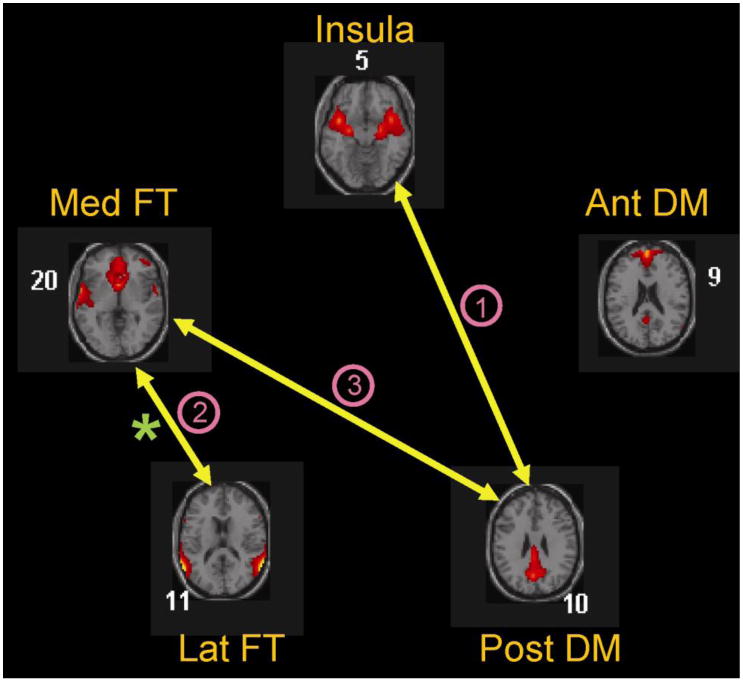
Figure 4.

FNC analysis showed that compared to controls, schizophrenia patients display reduced coupling between: (1) the posterior DM (Post DM) and insula networks, (2) the two fronto-temporal networks, namely the medial (Med FT) and the lateral (Lat FT), and (3) the Post DM and Med FT networks. In addition a correlation analysis revealed that the degree of modulation of the Lat FT network by ToM correlated significantly with the degree to which this network was coupled with the Med FT network (denoted by asterisk).
