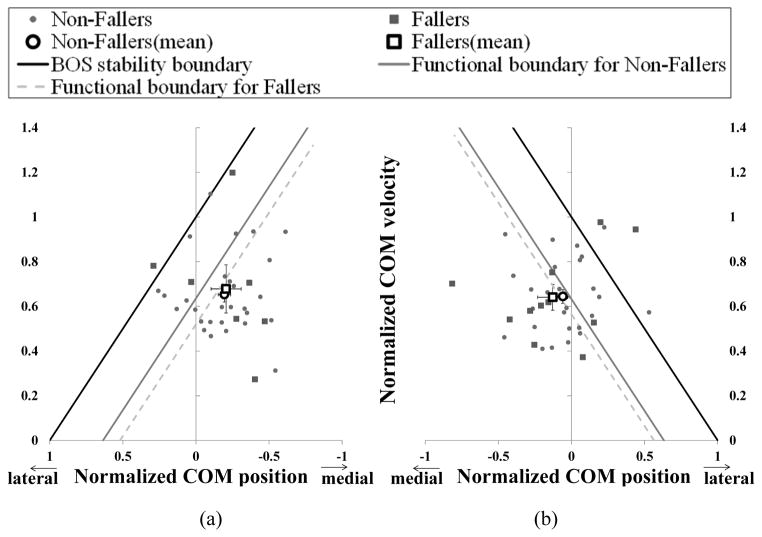
Figure 4.
Normalized COM velocity vs. normalized COM position at FSLO in the ML direction for Non-Fallers (◆) and Fallers (■) for (a) L pull and (b) R pull. Mean for each group (◇ and □) are also indicated. Error bars are SEM. The solid line indicates the BOS stability boundary. The two dashed lines indicate the functional stability boundaries for Non-Fallers and Fallers. Since the functional boundaries vary between subjects, the average for all subjects within the group was shown here.

